|


| |
|
January 2008 Stock
Picks |
| Stock Name |
SYM |
Exch. |
Sector |
Industry |
Date Picked |
Pick Price
(per share) |
ASG |
|
Denbury Resources Inc. |
DNR |
NYSE |
Energy
|
Oil & Gas Operations |
01/04/08 |
$31.16 |
48.20 (Good) |
|
Arena Resources Inc |
ARD |
NYSE |
Energy
|
Oil & Gas Operations |
01/11/08 |
$42.12 |
48.96 (Good) |
|
The Mosaic Co. |
MOS |
NYSE |
Basic Materials
|
Chemical Manufacturing |
01/18/08 |
$80.02 |
42.84 (Good) |
|
Meridian Bioscience Inc. |
VIVO |
NASD |
Healthcare
|
Biotechnology & Drugs |
01/25/08 |
$32.60 |
52.02 (Very Good) |
 Denbury Resources Inc. (NYSE:
DNR) is engaged in the acquisition, development, operation and exploration
of oil and natural gas properties in the Gulf
Coast region of the United States, primarily in Louisiana, Mississippi, Alabama,
and Texas. DNR's tertiary operations are its principal focus and core
assets. To date, DNR does not have any industry competition in its region
of operation. Generally, from the Texas Gulf Coast to Florida, there are no
known significant natural sources of carbon dioxide (CO2) except those of
DNR's, and these large volumes of CO2 are the foundation for DNR's
entire tertiary program.
Denbury Resources Inc. (NYSE:
DNR) is engaged in the acquisition, development, operation and exploration
of oil and natural gas properties in the Gulf
Coast region of the United States, primarily in Louisiana, Mississippi, Alabama,
and Texas. DNR's tertiary operations are its principal focus and core
assets. To date, DNR does not have any industry competition in its region
of operation. Generally, from the Texas Gulf Coast to Florida, there are no
known significant natural sources of carbon dioxide (CO2) except those of
DNR's, and these large volumes of CO2 are the foundation for DNR's
entire tertiary program.
The
stock's price gained 29.6% over the past 3 months (vs. the Industry's 30.1%);
56.7% over the past 6 months (vs. the Industry's58.8%); and 139.1% over
the past 12 months (vs. the Industry's 158.5%).
DNR
is classified as a
mid-cap growth company (with a market cap of $7.61B) that is rated to
outperform the market over the next six months with a Risk Level of 3 (Average).
DNR was
originally incorporated in Canada in 1951. In 1992, DNR acquired all of
the shares of a United States operating company, Denbury Management, Inc. (DMI),
and subsequent to the merger, all of DNR's Canadian assets were
sold. Since that time, all of DNR's operations have been in the United
States. DNR's principal executive offices
are at
Plana, Texas.
DNR has
629 employees.
Sector: Energy; Industry:
Oil & Gas Operations;
Ticker:DNR;
Exch:
NYSE;
01/04/08 Closing Price:
$31.16
STOCK GRADE (ASG): 48.20 ( GOOD)

 BUSINESS & FINANCIAL SUMMARY;
KEY STATS
(Yahoo)
BUSINESS & FINANCIAL SUMMARY;
KEY STATS
(Yahoo)
EXPANDED BUSINESS DESCRIPTION
(Reuters)
STOCK INFO/RESEARCH
(MSN)
COMPETITORS
(CNN Money)
OWNERSHIP
(MSN)
KEY DEVELOPMENTS
(MSN),
RECENT NEWS
(MSN) &
HEADLINES (Yahoo)
HISTORICAL PRICES (Yahoo)
&
PRICE CHART
(IQChart)
RISK LEVEL: 2
(Less than average)
(MSN)
COMPANY'S WEB SITE
|
Management's Effectiveness (Trailing
12 Mo.) |
. . . |
Return on Equity: |
17.33% |
|
Profitability (Trailing
12 Mo.) |
. . . |
Profit Margin: |
24.94% |
|
Stock's Growth Record
(Trailing
12 Mo.) |
. . . |
Revenue: |
30.54% |
|
. . . |
EPS: |
17.55% |
|
. . . |
Price: |
139.14% |
|
. . . |
Dividend: |
NA |
| PE & EPS (Trailing 12 Mo.) |
. . . |
Price/Earnings: |
38.66 |
|
. . . |
Earnings/Share: |
0.61 |
|
Price / Share (Pick Date, Closing Price) |
. . . |
Pick Date 01/04/2007: |
$31.16 |
COMMENT: The stock's pick price (of $31.16) is over the 13- and 50-day EMA price range; i.e.,
higher than
the 13-day EMA price
(of $29.86)
and over the 50-day EMA (of $27.67) by 4.35% and 12.61% respectively. This suggests that the pick price is
presently NOT timely NOR advantageous buy
price for the stock. (Note: A stock's EMA price changes with
time).
|
. . . |
|
|
| Price
/ Share (13-day EMA) |
. . . |
01/04/2008: |
$29.86 |
| Price
/ Share (50-day EMA) |
. . . |
01/04/2008: |
$27.67 |
| Price
/ Share (13-day EMA) |
. . . |
|
Current:
|
| Price
/ Share (50-day EMA) |
. . . |
|
Current: |
| Price
/ Share (Current) |
. . . |
Current Price |
Quote |
| Price
/ Share (Historical) |
. . . |
Historical Price |
Quote |
SPECIAL NOTE:
1. Denbury
posts record or near
record production, cash flow and earnings figures for 3rd quarter of 2007.
(Business Wire, November 1, 2007).
2. Denbury
reports total proved oil and natural gas reserves as of December 31, 2006
which replaces 260% ot the company's 2006 production
(SmartBrief; February 6, 2007).
3.
Denbury partners with Rentech Inc. for the use of all captured carbon
dioxide from Rentech’s proposed synthetic fuels plant
to be built in Mississippi.(SmartBrief;
June 25, 2007)
4.
OPEC, crude oil
prices and Denbury's stock price.
(Reuters; November 12, 2007).
5.
"Energy Stocks on the Cheap". Denbury is among these
stocks.
(Forbes; December 15, 2007)
^Top page
 Arena Resources Inc. (NYSE: ARD)
is engaged in oil and
natural gas acquisition, exploration, development and production, with
activities currently in Oklahoma, Texas, New Mexico and Kansas.
ARD focus is
on developing its existing properties, while continuing to pursue acquisitions
of oil and gas properties with upside potential. Since its inception in August
2000, ARD
have built its asset base and achieved growth primarily through property
acquisitions.
ARD have a
portfolio of oil and natural gas reserves, with approximately 84% of its proved
reserves consisting of oil and approximately 16% consisting of natural gas. Of
those reserves approximately 28% of the proved reserves are classified as proved
developed producing, or “PDP,” approximately 5% of the proved reserves are
classified as proved developed non-producing, or “PDNP,” approximately 5% are
classified as proved developed behind pipe “PDBP,” and approximately 62% are
classified as proved undeveloped, or “PUD.”
Arena Resources Inc. (NYSE: ARD)
is engaged in oil and
natural gas acquisition, exploration, development and production, with
activities currently in Oklahoma, Texas, New Mexico and Kansas.
ARD focus is
on developing its existing properties, while continuing to pursue acquisitions
of oil and gas properties with upside potential. Since its inception in August
2000, ARD
have built its asset base and achieved growth primarily through property
acquisitions.
ARD have a
portfolio of oil and natural gas reserves, with approximately 84% of its proved
reserves consisting of oil and approximately 16% consisting of natural gas. Of
those reserves approximately 28% of the proved reserves are classified as proved
developed producing, or “PDP,” approximately 5% of the proved reserves are
classified as proved developed non-producing, or “PDNP,” approximately 5% are
classified as proved developed behind pipe “PDBP,” and approximately 62% are
classified as proved undeveloped, or “PUD.”
The
stock's price gained 21.0% over the past 3 months (vs. the Industry's 41.9%);
40.6% over the past 6 months (vs. the Industry's 88.6%); and 125.5% over
the past 12 months (vs. the Industry's 246.3%).
ARD
is classified as a
mid-cap growth company (with a market cap of $1.44B) that is rated to
outperform the market over the next six months with a Risk Level of 2 (Less than
average).
ARD was
incorporated in 2000 and its principal executive offices
are located at Tulsa, Oklahoma.
ARD has
52 employees.
Sector: Energy; Industry:
Oil & Gas Operations; Ticker:ARD;
Exch:
NYSE;
01/11/08 Closing Price: $42.12
STOCK GRADE (ASG): 48.96 (GOOD)
BUSINESS & FINANCIAL SUMMARY;
KEY STATS
(Yahoo)
EXPANDED BUSINESS DESCRIPTION
(Reuters)
STOCK INFO/RESEARCH
(MSN)
COMPETITORS
(CNN Money)
OWNERSHIP
(MSN)
KEY DEVELOPMENTS
(MSN),
RECENT NEWS
(MSN) &
HEADLINES (Yahoo)
HISTORICAL PRICES (Yahoo)
&
PRICE CHART
(IQChart)
RISK LEVEL: 2
(Less than average)
(MSN)
COMPANY'S WEB SITE
|
Management's Effectiveness (Trailing
12 Mo.) |
. . . |
Return on Equity: |
16.70% |
|
Profitability (Trailing
12 Mo.) |
. . . |
Profit Margin: |
37.11% |
|
Stock's Growth Record
(Trailing
12 Mo.) |
. . . |
Revenue: |
131.24% |
|
. . . |
EPS: |
106.29% |
|
. . . |
Price: |
125.54% |
|
. . . |
Dividend: |
NA |
| PE & EPS (Trailing 12 Mo.) |
. . . |
Price/Earnings: |
45.29 |
|
. . . |
Earnings/Share: |
0.93 |
|
Price / Share (Pick Date, Closing Price) |
. . . |
Pick Date 01/11/2008: |
$42.12 |
COMMENT: The stock's pick price (of $42.12) is over the 13- and 50-day EMA price range; i.e.,
higher than
the 13-day EMA price
(of $41.70)
and 50-day EMA (of $38.91) by 1.00% and 8.24% respectively. This suggests that the pick price
is
presently NOT timely NOR advantageous buy
price for the stock. (Note: A stock's EMA price changes with
time).
|
. . . |
|
|
| Price
/ Share (13-day EMA) |
. . . |
01/11/2008: |
$41.70 |
| Price
/ Share (50-day EMA) |
. . . |
01/11/2008: |
$38.91 |
| Price
/ Share (13-day EMA) |
. . . |
|
Current:
|
| Price
/ Share (50-day EMA) |
. . . |
|
Current: |
| Price
/ Share (Current) |
. . . |
Current Price |
Quote |
| Price
/ Share (Historical) |
. . . |
Historical Price |
Quote |
SPECIAL NOTE:
1. Arena
Resources had record third quarter financial and operating results. (Business Wire,
November 9, 2007).
2. Arena
Resources adds an estimated 8
million barrels of oil equivalent of proved reserves in West Texas.
(Business
Wire; December 12, 2007).
^Top page
 The Mosaic Co. (NYSE:
MOS)
is a producer and
marketer of concentrated phosphate and potash crop nutrients for the global
agriculture industry.
MOS
is a single source supplier of phosphate-, potash- and nitrogen-based crop
nutrients and animal feed ingredients.
MOS
serve customers in approximately 45 countries; have phosphate mining operations
in Florida and phosphate production facilities in Florida and Louisiana; potash
mines and production facilities in Saskatchewan, Canada, New Mexico and
Michigan; strategic equity investments in phosphate and nitrogen production
facilities in Brazil and Canada; and other production, blending or distribution
operations or equity investments in nearly a dozen countries, including the top
four nutrient consuming countries in the world. The Mosaic Co. (NYSE:
MOS)
is a producer and
marketer of concentrated phosphate and potash crop nutrients for the global
agriculture industry.
MOS
is a single source supplier of phosphate-, potash- and nitrogen-based crop
nutrients and animal feed ingredients.
MOS
serve customers in approximately 45 countries; have phosphate mining operations
in Florida and phosphate production facilities in Florida and Louisiana; potash
mines and production facilities in Saskatchewan, Canada, New Mexico and
Michigan; strategic equity investments in phosphate and nitrogen production
facilities in Brazil and Canada; and other production, blending or distribution
operations or equity investments in nearly a dozen countries, including the top
four nutrient consuming countries in the world.
The
stock's price gained 28.0% over the past 3 months (vs. the Industry's 35.7%);
106.3% over the past 6 months (vs. the Industry's 120.7%); and 264.7% over
the past 12 months (vs. the Industry's 298.4%).
MOS
is classified as a
large-cap growth company (with a market cap of $35.46B) that is rated to
outperform the market over the next six months with a Risk Level of 3 (Average).
MOS was
incorporated in 2004 and its principal executive offices
are located at Plymouth, Minnesota.
MOS has
7,100 employees.
Sector:
Basic Materials; Industry:
Chemical Manufacturing; Ticker:MOS;
Exch:
NYSE;
01/18/08 Closing Price: $80.02
STOCK GRADE (ASG): 42.84 (GOOD)
BUSINESS & FINANCIAL SUMMARY;
KEY STATS
(Yahoo)
EXPANDED BUSINESS DESCRIPTION
(Reuters)
STOCK INFO/RESEARCH
(MSN)
COMPETITORS
(CNN Money)
OWNERSHIP
(MSN)
KEY DEVELOPMENTS
(MSN),
RECENT NEWS
(MSN) &
HEADLINES (Yahoo)
HISTORICAL PRICES (Yahoo)
&
PRICE CHART
(IQChart)
RISK LEVEL: 3
(Average)
(MSN)
COMPANY'S WEB SITE
|
Management's Effectiveness (Trailing
12 Mo.) |
. . . |
Return on Equity: |
21.37% |
|
Profitability (Trailing
12 Mo.) |
. . . |
Profit Margin: |
13.19% |
|
Stock's Growth Record
(Trailing
12 Mo.) |
. . . |
Revenue: |
8.82% |
|
. . . |
EPS: |
374.95% |
|
. . . |
Price: |
377.43% |
|
. . . |
Dividend: |
NA |
| PE & EPS (Trailing 12 Mo.) |
. . . |
Price/Earnings: |
48.26 |
|
. . . |
Earnings/Share: |
2.13 |
|
Price / Share (Pick Date, Closing Price) |
. . . |
Pick Date 01/18/2008: |
$80.02 |
COMMENT: The stock's pick price (of $80.02) is under the 13- and 50-day EMA price range; i.e.,
lower than
the 13-day EMA price
(of $91.33)
and 50-day EMA (of $82.19) by -12.38% and -2.65% respectively. This suggests that the pick price
IS
presently timely AND advantageous buy
price for the stock. (Note: A stock's EMA price changes with
time).
|
. . . |
|
|
| Price
/ Share (13-day EMA) |
. . . |
01/18/2008: |
$91.33 |
| Price
/ Share (50-day EMA) |
. . . |
01/18/2008: |
$82.19 |
| Price
/ Share (13-day EMA) |
. . . |
|
Current:
|
| Price
/ Share (50-day EMA) |
. . . |
|
Current: |
| Price
/ Share (Current) |
. . . |
Current Price |
Quote |
| Price
/ Share (Historical) |
. . . |
Historical Price |
Quote |
SPECIAL NOTE:
1. Mosaic
beats the Street's earning estimates. (Forbes.com;
January 9, 2008)
2. Mosaic's
6-fold increase in profit propels 3-fold increase in share price. (The Motley Fool; January 11, 2008).
3. Mosaic thriving on fertile ground. (Forbes.com; December 20, 2007)
4. Mosaic is best-managed company in the Chemicals industry. ("America's
Best Big Companies"; Forbes.com; December 20, 2007)
5.
Crops & Ag sector pulling back; a buy opportunity or just let the good times go?
(MarketWatch; January 15, 2008).
^Top page
 Meridian Bioscience Inc. (NASD:
VIVO)
is an integrated life
science company whose principal businesses are the development, manufacture,
sale and
distribution of diagnostic test kits, primarily for certain respiratory,
gastrointestinal, viral and parasitic infectious diseases; the manufacture and
distribution of bulk antigens, antibodies, and reagents used by researchers and
other diagnostic manufacturers; and the contract manufacture of proteins and
other
biologicals for use by biopharmaceutical and biotechnology companies engaged in
research for new drugs and vaccines.
VIVO's diagnostic test kits utilize
immunodiagnostic technologies, which test samples of blood, urine, stool, and
other body fluids or tissue for the presence of antigens and antibodies of
specific infectious diseases.
Meridian Bioscience Inc. (NASD:
VIVO)
is an integrated life
science company whose principal businesses are the development, manufacture,
sale and
distribution of diagnostic test kits, primarily for certain respiratory,
gastrointestinal, viral and parasitic infectious diseases; the manufacture and
distribution of bulk antigens, antibodies, and reagents used by researchers and
other diagnostic manufacturers; and the contract manufacture of proteins and
other
biologicals for use by biopharmaceutical and biotechnology companies engaged in
research for new drugs and vaccines.
VIVO's diagnostic test kits utilize
immunodiagnostic technologies, which test samples of blood, urine, stool, and
other body fluids or tissue for the presence of antigens and antibodies of
specific infectious diseases.
The
stock's price gained 0.9% over the past 3 months (vs. the Industry's -11.6%);
42.9% over the past 6 months (vs. the Industry's 6.3%); and 67.9% over
the past 12 months (vs. the Industry's 18.9%).
VIVO
is classified as a
small-cap growth company (with a market cap of $1.30B) that is rated to
outperform the market over the next six months with a Risk Level of 2 (Less than
average).
Meridian was
founded in 1976 and its principal executive offices
are located at Cincinnati, Ohio.
VIVO has
396 employees.
Sector:
Healthcare;
Industry:
Biotechnology & Drug;
Ticker: VIVO;
Exch:
NASD;
01/25/08 Closing Price:
$32.60
STOCK GRADE (ASG): 52.02 (VERY GOOD)
BUSINESS & FINANCIAL SUMMARY;
KEY STATS
(Yahoo)
EXPANDED BUSINESS DESCRIPTION
(Reuters)
STOCK INFO/RESEARCH
(MSN)
COMPETITORS
(CNN Money)
OWNERSHIP
(MSN)
KEY DEVELOPMENTS
(MSN),
RECENT NEWS
(MSN) &
HEADLINES (Yahoo)
HISTORICAL PRICES (Yahoo)
&
PRICE CHART
(IQChart)
RISK LEVEL: 2
(Less than average)
(MSN)
COMPANY'S WEB SITE
|
Management's Effectiveness (Trailing
12 Mo.) |
. . . |
Return on Equity: |
25.78% |
|
Profitability (Trailing
12 Mo.) |
. . . |
Profit Margin: |
21.10% |
|
Stock's Growth Record
(Trailing
12 Mo.) |
. . . |
Revenue: |
13.42% |
|
. . . |
EPS: |
43.70% |
|
. . . |
Price: |
67.92% |
|
. . . |
Dividend: |
42.86% |
| PE & EPS (Trailing 12 Mo.) |
. . . |
Price/Earnings: |
46.64 |
|
. . . |
Earnings/Share: |
0.70 |
|
Price / Share (Pick Date, Closing Price) |
. . . |
Pick Date 01/25/2008: |
$32.60 |
COMMENT: The stock's pick price (of $32.60) is under the 13- and over the 50-day EMA price range; i.e.,
lower than
the 13-day EMA price
(of $33.20)
and higher than the 50-day EMA (of $31.78) by -1.81% and 2.58% respectively. This suggests that the pick price
IS
presently timely AND advantageous buy
price for the stock. (Note: A stock's EMA price changes with
time).
|
. . . |
|
|
| Price
/ Share (13-day EMA) |
. . . |
01/25/2008: |
$33.20 |
| Price
/ Share (50-day EMA) |
. . . |
01/25/2008: |
$31.78 |
| Price
/ Share (13-day EMA) |
. . . |
|
Current:
|
| Price
/ Share (50-day EMA) |
. . . |
|
Current: |
| Price
/ Share (Current) |
. . . |
Current Price |
Quote |
| Price
/ Share (Historical) |
. . . |
Historical Price |
Quote |
SPECIAL NOTE:
1. Meridian reports record fiscal
2007 operating results. (Business
Wire; November 14, 2007)
2. Meridian provides sales and
earnings guidance for fiscal 2008. (SmartBrief August 14, 2007).
3. Meridian's profits surge in 1Q 2008. (Cincinnati
Enquirer; January 22, 2008)
4.
Discipline, R&D Boost Meridian
(CNN
Money; January 25 2008).
5. Top stocks of the next 50 yrs. Meridian's among the stocks.
(Motley
Fool; November 24, 2007)
^Top page
 Randgold Resources Ltd. ADR (NASD:
GOLD)
is engaged in gold
mining and exploration that are focused on West and East Africa.
RANDGOLD seeks to discover
bulk tonnage gold deposits, either from phased exploration programs or the
acquisition of early stage to mature exploration programs. In Mali,
RANDGOLD holds
interests in the Morila mine. In October 2005 the first gold was poured at
RANDGOLD's new Loulo mine, in which
RANDGOLD owns an 80% controlling interest, and work
has commenced on the development of two underground mines, Yalea and Gara. In
addition,
RANDGOLD have a feasibility stage project in the neighboring country of
Côte d’Ivoire, as well as exploration permits covering additional areas in Mali,
Côte d’Ivoire, Burkina Faso, Ghana and Senegal and exploration licenses in
Tanzania. Randgold Resources Ltd. ADR (NASD:
GOLD)
is engaged in gold
mining and exploration that are focused on West and East Africa.
RANDGOLD seeks to discover
bulk tonnage gold deposits, either from phased exploration programs or the
acquisition of early stage to mature exploration programs. In Mali,
RANDGOLD holds
interests in the Morila mine. In October 2005 the first gold was poured at
RANDGOLD's new Loulo mine, in which
RANDGOLD owns an 80% controlling interest, and work
has commenced on the development of two underground mines, Yalea and Gara. In
addition,
RANDGOLD have a feasibility stage project in the neighboring country of
Côte d’Ivoire, as well as exploration permits covering additional areas in Mali,
Côte d’Ivoire, Burkina Faso, Ghana and Senegal and exploration licenses in
Tanzania.
The
stock's price gained 25.5% over the past 3 months (vs. the Industry's 1.1%);
104.2% over the past 6 months (vs. the Industry's 66.4%); and 98.2% over
the past 12 months (vs. the Industry's 69.8%).
RANDGOLD
is classified as a
mi-cap company (with a market cap of $3.08B) that is rated to
outperform the market over the next six months with a Risk Level of 3 (Average).
RANDGOLD was
founded in 1985 and its principal executive offices
are located at St. Helier, Jersey, Channel Islands.
RANDGOLD has
1,440 employees.
Sector:
Basic Materials;
Industry:
Gold & Silver;
Ticker: GOLD;
Exch:
NASD;
02/04/08 Closing Price:
$44.19
STOCK GRADE (ASG): 49.73 (GOOD)
BUSINESS & FINANCIAL SUMMARY;
KEY STATS
(Yahoo)
EXPANDED BUSINESS DESCRIPTION
(Reuters)
STOCK INFO/RESEARCH
(MSN)
COMPETITORS
(CNN Money)
OWNERSHIP
(MSN)
KEY DEVELOPMENTS
(MSN),
RECENT NEWS
(MSN) &
HEADLINES (Yahoo)
HISTORICAL PRICES (Yahoo)
&
PRICE CHART
(IQChart)
RISK LEVEL: 3
(Average)
(MSN)
COMPANY'S WEB SITE
|
Management's Effectiveness (Trailing
12 Mo.) |
. . . |
Return on Equity: |
11.20% |
|
Profitability (Trailing
12 Mo.) |
. . . |
Profit Margin: |
13.30% |
|
Stock's Growth Record
(Trailing
12 Mo.) |
. . . |
Revenue: |
81.45% |
|
. . . |
EPS: |
4.12% |
|
. . . |
Price: |
98.17% |
|
. . . |
Dividend: |
NA |
| PE & EPS (Trailing 12 Mo.) |
. . . |
Price/Earnings: |
79.23 |
|
. . . |
Earnings/Share: |
0.56 |
|
Price / Share (Pick Date, Closing Price) |
. . . |
Pick Date 02/04/2008: |
$44.`19 |
COMMENT: The stock's pick price (of $44.19) is under the 13- and over the 50-day EMA price range; i.e.,
lower than
the 13-day EMA price
(of $45.38)
and higher than the 50-day EMA (of $40.55) by -2.61% and 8.99% respectively. This suggests that the pick price
IS
presently timely AND advantageous buy
price for the stock. (Note: A stock's EMA price changes with
time).
|
. . . |
|
|
| Price
/ Share (13-day EMA) |
. . . |
02/02/2008: |
$45.38 |
| Price
/ Share (50-day EMA) |
. . . |
02/02/2008: |
$40.55 |
| Price
/ Share (13-day EMA) |
. . . |
|
Current:
|
| Price
/ Share (50-day EMA) |
. . . |
|
Current: |
| Price
/ Share (Current) |
. . . |
Current Price |
Quote |
| Price
/ Share (Historical) |
. . . |
Historical Price |
Quote |
SPECIAL NOTE:
1. Stocks you wish you'd bought.
Randgold is one of those stocks. (Motley
Fool; January 18, 2008)
2. Randgold
profits dip, gold to boost 2008 earnings.
(Mail&Guardian;
February 4, 2008).
3. Market forces - why investors
turns to gold. (The
Observer; November 4, 2007).
4. In overdrive to $1,000 Gold. Randgold is one of the stock's
recommended in this environment. (Barron's;
October 1, 2007)
5. Gold,
platinum leads commodities jump as investors shun stocks.
(Bloomberg.com;
January 9, 2008)
^Top page
 Ritchie Bros. Auctioneers Inc. (NYSE: RBA)
is an auctioneer of
industrial equipment operating from over 110 locations, including 29 auction
sites, in 25 countries around the world.
RBA sell,
through unreserved public auctions, a broad range of assets, including trucks
and equipment used in the construction, transportation, mining, forestry,
petroleum, material handling, marine and agricultural industries.
RBA customers
are primarily end users of equipment (retail buyers), such as contractors, and
they also include equipment manufacturers, dealers, brokers and finance
companies (wholesale buyers).
Ritchie Bros. Auctioneers Inc. (NYSE: RBA)
is an auctioneer of
industrial equipment operating from over 110 locations, including 29 auction
sites, in 25 countries around the world.
RBA sell,
through unreserved public auctions, a broad range of assets, including trucks
and equipment used in the construction, transportation, mining, forestry,
petroleum, material handling, marine and agricultural industries.
RBA customers
are primarily end users of equipment (retail buyers), such as contractors, and
they also include equipment manufacturers, dealers, brokers and finance
companies (wholesale buyers).
The
stock's price gained 11.4% over the past 3 months (vs. the Industry's -24.4%);
34.2% over the past 6 months (vs. the Industry's 2.6%); and 44.6% over
the past 12 months (vs. the Industry's 12.7%).
RBA
is classified as a
mid-cap growth company (with a market cap of $2.93B) that is rated to
outperform the market over the next six months with a Risk Level of 2 (Less than
average).
RBA was
incorporated in Canada in 1963 and its principal executive offices
are located at Richmond, British Columbia.
RBA has
907 employees.
Sector:
Services; Industry:
Retail (Specialty); Ticker:RBA;
Exch:
NYSE;
02/08/08 Closing Price: $84.19
STOCK GRADE (ASG): 52.79 (
VERY GOOD)
BUSINESS & FINANCIAL SUMMARY;
KEY STATS
(Yahoo)
EXPANDED BUSINESS DESCRIPTION
(Reuters)
STOCK INFO/RESEARCH
(MSN)
COMPETITORS
(CNN Money)
OWNERSHIP
(MSN)
KEY DEVELOPMENTS
(MSN),
RECENT NEWS
(MSN) &
HEADLINES (Yahoo)
HISTORICAL PRICES (Yahoo)
&
PRICE CHART
(IQChart)
RISK LEVEL: 2
(Less than average)
(MSN)
COMPANY'S WEB SITE
|
Management's Effectiveness (Trailing
12 Mo.) |
. . . |
Return on Equity: |
17.47% |
|
Profitability (Trailing
12 Mo.) |
. . . |
Profit Margin: |
22.73% |
|
Stock's Growth Record
(Trailing
12 Mo.) |
. . . |
Revenue: |
22.77% |
|
. . . |
EPS: |
6.42% |
|
. . . |
Price: |
44.58% |
|
. . . |
Dividend: |
NA |
| PE & EPS (Trailing 12 Mo.) |
. . . |
Price/Earnings: |
42.82 |
|
. . . |
Earnings/Share: |
1.97 |
|
Price / Share (Pick Date, Closing Price) |
. . . |
Pick Date 02/08/2008: |
$84.19 |
COMMENT: The stock's pick price (of $84.19) is over the 13- and 50-day EMA price range; i.e.,
higher than
the 13-day EMA price
(of $81.25)
and 50-day EMA (of $78.28) by3.62% and 7.56 respectively. This suggests that the pick price
is
presently NOT timely NOR advantageous buy
price for the stock. (Note: A stock's EMA price changes with
time).
|
. . . |
|
|
| Price
/ Share (13-day EMA) |
. . . |
02/08/2008: |
$81.25 |
| Price
/ Share (50-day EMA) |
. . . |
02/08/2008: |
$78.28 |
| Price
/ Share (13-day EMA) |
. . . |
|
Current:
|
| Price
/ Share (50-day EMA) |
. . . |
|
Current: |
| Price
/ Share (Current) |
. . . |
Current Price |
Quote |
| Price
/ Share (Historical) |
. . . |
Historical Price |
Quote |
SPECIAL NOTE:
1. Ritchie
Bros. announces record-breaking $3.18B 2007 gross auction
proceeds.(Business Wire,
December 20, 2007).
2. Ritchie Bros. Auctioneers results show continued strength with record
9-month performance of $59 million.
(SmartBrief;
October 30, 2007).
3.
Analysts boosts Ritchie Bros. 12-month share target to $80 from $72.
(Seeking
Alpha; November 1, 2007).
4. Analysts still bullish on Ritchie Bros. Auctioneers.
(Seeking
Alpha; January 6, 2008)
5.
Report names Ritchie Bros. among key investment opportunities in Canada's
infrastructure and
construction boom.
(CNW
Group; January 8, 2008).
^Top page
 Companhia Siderurgica Nacional ADS (NYSE: SID) is
the second largest fully integrated steel producer in Brazil and one of the
largest in Latin America in terms of crude steel production. SID's
current annual crude steel capacity and rolled product capacity is 5.6 million
and 5.1 million tons, respectively. Production of crude steel and rolled steel
products decreased in 2006 to 3.5 million and 4.2 million tons, respectively.
SID's fully-integrated manufacturing
facilities produce a broad line of steel products, including slabs, hot- and
cold-rolled, galvanized and tin mill products for the distribution,
packaging, automotive, home appliance and construction industries. In 2006,
SID accounted for approximately 42.0% of the galvanized steel products
sold in Brazil. SID is also one of the world’s leading producers of tin
mill products for packaging containers. In 2006, SID accounted for
approximately 98% of the tin mill products sold in Brazil.
Companhia Siderurgica Nacional ADS (NYSE: SID) is
the second largest fully integrated steel producer in Brazil and one of the
largest in Latin America in terms of crude steel production. SID's
current annual crude steel capacity and rolled product capacity is 5.6 million
and 5.1 million tons, respectively. Production of crude steel and rolled steel
products decreased in 2006 to 3.5 million and 4.2 million tons, respectively.
SID's fully-integrated manufacturing
facilities produce a broad line of steel products, including slabs, hot- and
cold-rolled, galvanized and tin mill products for the distribution,
packaging, automotive, home appliance and construction industries. In 2006,
SID accounted for approximately 42.0% of the galvanized steel products
sold in Brazil. SID is also one of the world’s leading producers of tin
mill products for packaging containers. In 2006, SID accounted for
approximately 98% of the tin mill products sold in Brazil.
The
stock's price gained 40.4% over the past 3 months (vs. the Industry's 1.1%);
127.7% over the past 6 months (vs. the Industry's 171.2%); and 181.4% over
the past 12 months (vs. the Industry's 235.9%). SID
is classified as a
large-cap company (with a market cap of $27.19B) that is rated to
outperform the market over the next six months with a Risk Level of 3 (Average).
SID
was incorporated in Brazil in 1941 and its principal executive offices
are located at Sao Paulo, Brazil..
SID
has
13,659 employees.
Sector: Basic
Material; Industry:
Iron & Steel; Ticker:SID;
Exch:
NYSE;
02/15/08 Closing Price: $35.33
STOCK GRADE (ASG): 45.90 (GOOD)
BUSINESS & FINANCIAL SUMMARY;
KEY STATS
(Yahoo)
EXPANDED BUSINESS DESCRIPTION
(Reuters)
STOCK INFO/RESEARCH
(MSN)
COMPETITORS
(CNN Money)
OWNERSHIP
(MSN)
KEY DEVELOPMENTS
(MSN),
RECENT NEWS
(MSN) &
HEADLINES (Yahoo)
HISTORICAL PRICES (Yahoo)
&
PRICE CHART
(IQChart)
RISK LEVEL: 3
(Average)
(MSN)
COMPANY'S WEB SITE
|
Management's Effectiveness (Trailing
12 Mo.) |
. . . |
Return on Equity: |
31.94% |
|
Profitability (Trailing
12 Mo.) |
. . . |
Profit Margin: |
22.70% |
|
Stock's Growth Record
(Trailing
12 Mo.) |
. . . |
Revenue: |
50.94% |
|
. . . |
EPS: |
61.56% |
|
. . . |
Price: |
181.44% |
|
. . . |
Dividend: |
-1.11 |
| PE & EPS (Trailing 12 Mo.) |
. . . |
Price/Earnings: |
19.10 |
|
. . . |
Earnings/Share: |
1.85 |
|
Price / Share (Pick Date, Closing Price) |
. . . |
Pick Date 02/15/2008: |
$35.33 |
COMMENT: The stock's pick price (of $35.33) is over the 13- and 50-day EMA price range; i.e.,
higher than
the 13-day EMA price
(of $32.83)
and 50-day EMA (of $29.71) by 7.63% and18.92% respectively. This suggests that the pick price
is
presently NOT timely NOR advantageous buy
price for the stock. (Note: A stock's EMA price changes with
time).
|
. . . |
|
|
| Price
/ Share (13-day EMA) |
. . . |
02/15/2008: |
$32.83 |
| Price
/ Share (50-day EMA) |
. . . |
02/15/2008: |
$29.71 |
| Price
/ Share (13-day EMA) |
. . . |
|
Current:
|
| Price
/ Share (50-day EMA) |
. . . |
|
Current: |
| Price
/ Share (Current) |
. . . |
Current Price |
Quote |
| Price
/ Share (Historical) |
. . . |
Historical Price |
Quote |
SPECIAL NOTE:
1. Steel makers bend, but did not break
as demand drives prices higher.(Investors
Business Daily; February 6, 2008).
2. Brazil's 7 chemical energy and mining stocks.
(Seeking
Alpha; January 8, 2008).
3.
South America's best stocks.
(Motley
Fool; January 2, 2008).
4. Brazil's booming mining industry.
(Forbes;
October 11, 2007)
^Top page
 CF Industries Inc. (NYSE: CF)
is one of the largest
manufacturers and distributors of nitrogen and phosphate fertilizer products in
North America. CF's operations are organized into two business segments: the
nitrogen fertilizer business and the phosphate fertilizer business. CF's
principal products in the nitrogen fertilizer business are ammonia, urea and
urea ammonium nitrate solution (UAN). CF's principal products in the phosphate
fertilizer business are diammonium phosphate (DAP) and monoammonium phosphate
(MAP). For the twelve months ended June 30, 2005, CF supplied approximately 24%
of the nitrogen and approximately 12% of the phosphate used in agricultural
fertilizer applications in the United States. CF's core market and distribution
facilities are concentrated in the mid-western U.S. grain-producing states.
CF Industries Inc. (NYSE: CF)
is one of the largest
manufacturers and distributors of nitrogen and phosphate fertilizer products in
North America. CF's operations are organized into two business segments: the
nitrogen fertilizer business and the phosphate fertilizer business. CF's
principal products in the nitrogen fertilizer business are ammonia, urea and
urea ammonium nitrate solution (UAN). CF's principal products in the phosphate
fertilizer business are diammonium phosphate (DAP) and monoammonium phosphate
(MAP). For the twelve months ended June 30, 2005, CF supplied approximately 24%
of the nitrogen and approximately 12% of the phosphate used in agricultural
fertilizer applications in the United States. CF's core market and distribution
facilities are concentrated in the mid-western U.S. grain-producing states.
The
stock's price gained 53.0% over the past 3 months (vs. the Industry's 103.9%);
99.2% over the past 6 months (vs. the Industry's 218.2%); and 224.7% over
the past 12 months (vs. the Industry's 372.3%). CF
is classified as a
mid-cap growth company (with a market cap of $7.04B) that is rated to
outperform the market over the next six months with a Risk Level of 2 (Less than
average).
CF
was founded in 1946 as a fertilizer brokerage operation by a group of regional
agricultural cooperatives seeking to pool their purchasing power. CF's principal executive offices
are located at Long Grove, Illinois.
CF
has
1,400 employees.
Sector:
Basic
Material;
Industry: Chemical Manufacturing;
Ticker: CF;
Exch:
NYSE;
02/22/08 Closing Price:
$125.86
STOCK GRADE (ASG): 48.20 (GOOD)
BUSINESS & FINANCIAL SUMMARY;
KEY STATS
(Yahoo)
EXPANDED BUSINESS DESCRIPTION
(Reuters)
STOCK INFO/RESEARCH
(MSN)
COMPETITORS
(CNN Money)
OWNERSHIP
(MSN)
KEY DEVELOPMENTS
(MSN),
RECENT NEWS
(MSN) &
HEADLINES (Yahoo)
HISTORICAL PRICES (Yahoo)
&
PRICE CHART
(IQChart)
RISK LEVEL: 3
(Average)
(MSN)
COMPANY'S WEB SITE
|
Management's Effectiveness (Trailing
12 Mo.) |
. . . |
Return on Equity: |
38.15% |
|
Profitability (Trailing
12 Mo.) |
. . . |
Profit Margin: |
13.52% |
|
Stock's Growth Record
(Trailing
12 Mo.) |
. . . |
Revenue: |
35.60% |
|
. . . |
EPS: |
987.63% |
|
. . . |
Price: |
224.72% |
|
. . . |
Dividend: |
100.00% |
| PE & EPS (Trailing 12 Mo.) |
. . . |
Price/Earnings: |
19.15 |
|
. . . |
Earnings/Share: |
6.57 |
|
Price / Share (Pick Date, Closing Price) |
. . . |
Pick Date 02/22/2008: |
$125.86 |
COMMENT: The stock's pick price (of $125.86) is over the 13- and 50-day EMA price range; i.e.,
higher than
the 13-day EMA price
(of $117.69)
and 50-day EMA (of $107.13) by 6.94% and 17.49% respectively. This suggests that the pick price
is
presently NOT timely NOR advantageous buy
price for the stock. (Note: A stock's EMA price changes with
time).
|
. . . |
|
|
| Price
/ Share (13-day EMA) |
. . . |
02/22/2008: |
$117.69 |
| Price
/ Share (50-day EMA) |
. . . |
02/22/2008: |
$107.13 |
| Price
/ Share (13-day EMA) |
. . . |
|
Current:
|
| Price
/ Share (50-day EMA) |
. . . |
|
Current: |
| Price
/ Share (Current) |
. . . |
Current Price |
Quote |
| Price
/ Share (Historical) |
. . . |
Historical Price |
Quote |
SPECIAL NOTE:
1. Growth areas: Seeds and fertilizers.
(U.S.
News & World Report; January 24, 2008).
2. CF Industries reports
best-ever net income for 4th quarter 2007. (Business
Wire; February 7, 2008).
3. Four sectors that defied the February sell-off, should outperform the market.
(The
Street.com; February 11, 2008).
4. Agri suppliers - 2008's standout high growth industries.
(Zacks.com;
February 19 2008).
5.
Potash CEO says "crop boom just beginning", fertilizer makers gain.
(Bloomberg.com;
February 24, 2008).
^Top page
 Compass Minerals International Inc. (NYSE: CMP)
is the second-leading
salt producer in North America and the largest in the United Kingdom.
CMP
currently operate 10 production and packaging facilities, including the largest
rock salt mine in the world in Ontario and the largest salt mine in the United
Kingdom. Our product lines include salt, consisting of sodium chloride and
magnesium chloride, which is used for highway deicing, dust control, consumer
deicing, water conditioning, consumer and industrial food preparation,
agriculture and industrial applications. In addition,
CMP
is North America’s leading producer of sulfate of potash "SOP"), which is used
in the production of specialty fertilizers for high-value crops and turf.
CMP's
North American salt mines and SOP production facility are near either water or
rail transport systems, which reduces our shipping and handling costs.
Compass Minerals International Inc. (NYSE: CMP)
is the second-leading
salt producer in North America and the largest in the United Kingdom.
CMP
currently operate 10 production and packaging facilities, including the largest
rock salt mine in the world in Ontario and the largest salt mine in the United
Kingdom. Our product lines include salt, consisting of sodium chloride and
magnesium chloride, which is used for highway deicing, dust control, consumer
deicing, water conditioning, consumer and industrial food preparation,
agriculture and industrial applications. In addition,
CMP
is North America’s leading producer of sulfate of potash "SOP"), which is used
in the production of specialty fertilizers for high-value crops and turf.
CMP's
North American salt mines and SOP production facility are near either water or
rail transport systems, which reduces our shipping and handling costs.
The
stock's price gained 55.0% over the past 3 months (vs. the Industry's 98.4%);
67.1% over the past 6 months (vs. the Industry's 287.0%); and 74.5% over
the past 12 months (vs. the Industry's 555.6%).
CMP is classified as a
mid-cap growth company (with a market cap of $1.84B) that is rated to
outperform the market over the next six months with a Risk Level of 2 (Less than
average).
CMP became a standalone entity on 2001 through a leveraged recapitalization
through which Apollo Management V, L.P. acquired control of the Company.
CMP principal executive offices
are located at Overland Park, Kansas.
CMP
has
1,588 employees.
Sector:
Basic
Material;
Industry: Non-Metallic Mining;
Ticker: CMP;
Exch:
NYSE;
02/29/08 Closing Price:
$56.92
STOCK GRADE (ASG): 48.96 (GOOD)
BUSINESS & FINANCIAL SUMMARY;
KEY STATS
(Yahoo)
EXPANDED BUSINESS DESCRIPTION
(Reuters)
STOCK INFO/RESEARCH
(MSN)
COMPETITORS
(CNN Money)
OWNERSHIP
(MSN)
KEY DEVELOPMENTS
(MSN),
RECENT NEWS
(MSN) &
HEADLINES (Yahoo)
HISTORICAL PRICES (Yahoo)
&
PRICE CHART
(IQChart)
RISK LEVEL: 2
(Less than average)
(MSN)
COMPANY'S WEB SITE
|
Management's Effectiveness (Trailing
12 Mo.) |
. . . |
Return on Equity: |
NA |
|
Profitability (Trailing
12 Mo.) |
. . . |
Profit Margin: |
9.33% |
|
Stock's Growth Record
(Trailing
12 Mo.) |
. . . |
Revenue: |
29.76% |
|
. . . |
EPS: |
43.96% |
|
. . . |
Price: |
74.49% |
|
. . . |
Dividend: |
4.92% |
| PE & EPS (Trailing 12 Mo.) |
. . . |
Price/Earnings: |
23.43 |
|
. . . |
Earnings/Share: |
2.43 |
|
Price / Share (Pick Date, Closing Price) |
. . . |
Pick Date 02/29/2008: |
$56.92 |
COMMENT: The stock's pick price (of $56.92) is over the 13- and 50-day EMA price range; i.e.,
higher than
the 13-day EMA price
(of $54.65)
and 50-day EMA (of $46.80) by 4.14% and 22.14% respectively. This suggests that the pick price
is
presently NOT timely NOR advantageous buy
price for the stock. (Note: A stock's EMA price changes with
time).
|
. . . |
|
|
| Price
/ Share (13-day EMA) |
. . . |
02/29/2008: |
$54.65 |
| Price
/ Share (50-day EMA) |
. . . |
02/29/2008: |
$46.60 |
| Price
/ Share (13-day EMA) |
. . . |
|
Current:
|
| Price
/ Share (50-day EMA) |
. . . |
|
Current: |
| Price
/ Share (Current) |
. . . |
Current Price |
Quote |
| Price
/ Share (Historical) |
. . . |
Historical Price |
Quote |
SPECIAL NOTE:
1. Compass Minerals reports
record full-year sales, earnings and cash flow
(MSN
Money; February 11, 2008).
2. A stock for all season. (Motley
Fool; February 13, 2008).
3. A cold, icy winter translates into a hot year for salt miner's profits.
(Investors
Business Daily; February 23, 2008).
^Top page
|
March
2008 Stock Picks |
| Stock Name |
SYM |
Exch. |
Sector |
Industry |
Date Picked |
Pick Price
(per share) |
ASG |
|
Comp De Minas Buenaventura S.A. Ads |
BVN |
NYSE |
Basic Materials
|
Gold & Silver |
03/07/08 |
$75.77 |
47.43 (Good) |
|
Mechel Steel Group OAO |
MTL |
NYSE |
Basic Materials
|
Iron & Steel |
03/14/08 |
$137.24 |
48.20 (Good) |
 Comp
De Minas Buenaventura S.A. Ads (NYSE: BVN)
is Peru's largest publicly-traded precious metals company, and is engaged in the
exploration, mining and processing of gold, silver and, to a lesser extent,
other metals, in Peru.
BVN currently operate the Julcani, Recuperada, Orcopampa, Uchucchacua, Antapite and
Ishihuinca mines and have controlling interests in two other mining companies
which operate the Colquijirca, and Shila-Paula mines.
BVN also own an electric power transmission company and an engineering services
consulting company and have minority interests in several other mining
companies, including a significant ownership interest in Yanacocha, a Peruvian
partnership that operates South America's largest gold mine,
and Cerro Verde, a Peruvian company that operates a copper mine located in the
south of Peru. Comp
De Minas Buenaventura S.A. Ads (NYSE: BVN)
is Peru's largest publicly-traded precious metals company, and is engaged in the
exploration, mining and processing of gold, silver and, to a lesser extent,
other metals, in Peru.
BVN currently operate the Julcani, Recuperada, Orcopampa, Uchucchacua, Antapite and
Ishihuinca mines and have controlling interests in two other mining companies
which operate the Colquijirca, and Shila-Paula mines.
BVN also own an electric power transmission company and an engineering services
consulting company and have minority interests in several other mining
companies, including a significant ownership interest in Yanacocha, a Peruvian
partnership that operates South America's largest gold mine,
and Cerro Verde, a Peruvian company that operates a copper mine located in the
south of Peru.
The
stock's price gained 37.3% over the past 3 months (vs. the Industry's 45.6%);
78.7% over the past 6 months (vs. the Industry's 94.2%); and 178.0% over
the past 12 months (vs. the Industry's 137.3%).
BVN is classified as a
mid-cap growth company (with a market cap of $14.45B) that is rated to
outperform the market over the next six months with a Risk Level of 2 (Less than
average).
BVN was originally established in 1953. BVN's registered office is located at Lima Peru.
BVN
has
2,487 employees.
Sector:
Basic
Material;
Industry:
Gold & Silver;
Ticker: BVN;
Exch:
NYSE;
03/07/08 Closing Price:
$75.77
STOCK GRADE (ASG): 47.43 (GOOD)
BUSINESS & FINANCIAL SUMMARY;
KEY STATS
(Yahoo)
EXPANDED BUSINESS DESCRIPTION
(Reuters)
STOCK INFO/RESEARCH
(MSN)
COMPETITORS
(CNN Money)
OWNERSHIP
(MSN)
KEY DEVELOPMENTS
(MSN),
RECENT NEWS
(MSN) &
HEADLINES (Yahoo)
HISTORICAL PRICES (Yahoo)
&
PRICE CHART
(IQChart)
RISK LEVEL: 2
(Less than average)
(MSN)
COMPANY'S WEB SITE
|
Management's Effectiveness (Trailing
12 Mo.) |
. . . |
Return on Equity: |
28.45% |
|
Profitability (Trailing
12 Mo.) |
. . . |
Profit Margin: |
13.77% |
|
Stock's Growth Record
(Trailing
12 Mo.) |
. . . |
Revenue: |
77.80% |
|
. . . |
EPS: |
44.73% |
|
. . . |
Price: |
177.95% |
|
. . . |
Dividend: |
68.45% |
| PE & EPS (Trailing 12 Mo.) |
. . . |
Price/Earnings: |
15.94 |
|
. . . |
Earnings/Share: |
6.53 |
|
Price / Share (Pick Date, Closing Price) |
. . . |
Pick Date 03/07/2008: |
$75.77 |
COMMENT: The stock's pick price (of $75.77) is over the 13- and 50-day EMA price range; i.e.,
higher than the 13-day EMA price
(of $74.73)
and 50-day EMA (of $67.81) by 1.40% and 11.75% respectively. This suggests that the pick price
is
presently NOT timely NOR advantageous buy
price for the stock. (Note: A stock's EMA price changes with
time).
|
. . . |
|
|
| Price
/ Share (13-day EMA) |
. . . |
03/07/2008: |
$74.73 |
| Price
/ Share (50-day EMA) |
. . . |
03/07/2008: |
$67.81 |
| Price
/ Share (13-day EMA) |
. . . |
|
Current:
|
| Price
/ Share (50-day EMA) |
. . . |
|
Current: |
| Price
/ Share (Current) |
. . . |
Current Price |
Quote |
| Price
/ Share (Historical) |
. . . |
Historical Price |
Quote |
SPECIAL NOTE:
 Mechel Steel Group OAO (NYSE: MTL)
is a low-cost integrated
mining and steel group with revenues of $4.4 billion in 2006.
MTL's steel
business comprises the production and sale of semi-finished steel products,
carbon and specialty long products, carbon and stainless flat products and
value-added downstream metal products including hardware, stampings and
forgings. It also produces significant amounts of coke, both for internal use
and for sales to third parties.
MTL is the largest and most comprehensive
producer of specialty steels and alloys in Russia, producing 39% of total
Russian specialty steel output in 2006.
MTL is also the third largest producer
in Russia of long products.
Mechel Steel Group OAO (NYSE: MTL)
is a low-cost integrated
mining and steel group with revenues of $4.4 billion in 2006.
MTL's steel
business comprises the production and sale of semi-finished steel products,
carbon and specialty long products, carbon and stainless flat products and
value-added downstream metal products including hardware, stampings and
forgings. It also produces significant amounts of coke, both for internal use
and for sales to third parties.
MTL is the largest and most comprehensive
producer of specialty steels and alloys in Russia, producing 39% of total
Russian specialty steel output in 2006.
MTL is also the third largest producer
in Russia of long products.
The
stock's price gained 47.7% over the past 3 months (vs. the Industry's 35.8%);
190.6% over the past 6 months (vs. the Industry's 143.5%); and 344.7% over
the past 12 months (vs. the Industry's 372.5%).
MTL is classified as a
large-cap growth company (with a market cap of $19.04B) that is rated to
outperform the market over the next six months with a Risk Level of 3 (Average).
MTL was
incorporated on 2003, under the laws of the Russian Federation. MTL's
principal executive offices are located at Moscow, Russian Federation.
MTL
has
76,566 employees.
Sector:
Basic
Material;
Industry: Iron & Steel;
Ticker:
MTL;
Exch:
NYSE;
03/14/08
Closing Price:
$137.24
STOCK GRADE (ASG): 48.20 (GOOD)
BUSINESS & FINANCIAL SUMMARY;
KEY STATS
(Yahoo)
EXPANDED BUSINESS DESCRIPTION
(Reuters)
STOCK INFO/RESEARCH
(MSN)
COMPETITORS
(CNN Money)
OWNERSHIP
(MSN)
KEY DEVELOPMENTS
(MSN),
RECENT NEWS
(MSN) &
HEADLINES (Yahoo)
HISTORICAL PRICES (Yahoo)
&
PRICE CHART
(IQChart)
RISK LEVEL: 3
(Average)
(MSN)
COMPANY'S WEB SITE
|
Management's Effectiveness (Trailing
12 Mo.) |
. . . |
Return on Equity: |
31.76% |
|
Profitability (Trailing
12 Mo.) |
. . . |
Profit Margin: |
15.88% |
|
Stock's Growth Record
(Trailing
12 Mo.) |
. . . |
Revenue: |
15.58% |
|
. . . |
EPS: |
55.38% |
|
. . . |
Price: |
326.02% |
|
. . . |
Dividend: |
-4.17% |
| PE & EPS (Trailing 12 Mo.) |
. . . |
Price/Earnings: |
20.32 |
|
. . . |
Earnings/Share: |
6.75 |
|
Price / Share (Pick Date, Closing Price) |
. . . |
Pick Date 03/14/2008: |
$137.24 |
COMMENT: The stock's pick price (of $137.24) is over the 13- and 50-day EMA price range; i.e.,
higher than
the 13-day EMA price
(of $132.21)
and 50-day EMA (of $114.02) by 3.80% and 20.36% respectively. This suggests that the pick price
is
presently NOT timely NOR advantageous buy
price for the stock. (Note: A stock's EMA price changes with
time).
|
. . . |
|
|
| Price
/ Share (13-day EMA) |
. . . |
03/14/2008: |
$132.21 |
| Price
/ Share (50-day EMA) |
. . . |
03/14/2008: |
$114.02 |
| Price
/ Share (13-day EMA) |
. . . |
|
Current:
|
| Price
/ Share (50-day EMA) |
. . . |
|
Current: |
| Price
/ Share (Current) |
. . . |
Current Price |
Quote |
| Price
/ Share (Historical) |
. . . |
Historical Price |
Quote
|
SPECIAL NOTE:
1. Mechel 9-months net rises
89.7%, revenue up 47.9%.
(Forbes;
December 11, 2007)
2. From Russia with love and plenty of pit. (Seeking
Alpha; Decmber 26, 2007)
3. Best Stocks for 2008: Mining for value at Russia's Mechel.
(BloggingStocks;
December 28, 2007)
4.
Compelling opportunities for investors in Emerging Markets.
(Barrons;
March 10, 2008).
^Top page
|
April
2008 Stock Picks |
| Stock Name |
SYM |
Exch. |
Sector |
Industry |
Date Picked |
Pick Price
(per share) |
ASG |
|
Perrigo Co |
PRGO |
NASD |
Healthcare
|
Biotechnology & Drugs |
04/04/08 |
$39.48 |
45.90 (Good) |
|
Consol Energy Inc |
CNX |
NYSE |
Energy
|
Coal |
04/11/08 |
$75.63 |
47.43 (Good) |
|
Apache Corp. |
APA |
NYSE |
Energy
|
Oil & Gas Operations |
04/18/08 |
$142.51 |
55.08 (Very Good) |
Cleveland-Cliffs Inc. |
CLF |
NYSE |
Basic Materials
|
Metal Mining |
04/25/08 |
$162.32 |
48.96 (Good) |
 Perrigo Co. (NASD: PRGO)
is a global healthcare
supplier that develops, manufactures and distributes over-the-counter (OTC) and
prescription
pharmaceuticals, nutritional products, active pharmaceutical ingredients (API)
and consumer products. The Company is the world's largest
manufacturer of OTC pharmaceutical products for the store brand market. The
Company's primary markets and locations of manufacturing and logistics
operations are the United States, Israel, Mexico and the United Kingdom.
Company has three reportable segments, aligned primarily by product:
Consumer Healthcare, Prescription (Rx) Pharmaceuticals and API.
Perrigo Co. (NASD: PRGO)
is a global healthcare
supplier that develops, manufactures and distributes over-the-counter (OTC) and
prescription
pharmaceuticals, nutritional products, active pharmaceutical ingredients (API)
and consumer products. The Company is the world's largest
manufacturer of OTC pharmaceutical products for the store brand market. The
Company's primary markets and locations of manufacturing and logistics
operations are the United States, Israel, Mexico and the United Kingdom.
Company has three reportable segments, aligned primarily by product:
Consumer Healthcare, Prescription (Rx) Pharmaceuticals and API.
The
stock's price gained 19.5% over the past 3 months (vs. the Industry's 37.2%);
84.4% over the past 6 months (vs. the Industry's 13.8%); and 116.7% over
the past 12 months (vs. the Industry's 14.2%). The Company is classified as a
mid-cap growth company (with a market cap of $3.67B) that is rated to
outperform the market over the next six months with a Risk Level of 2 (Less than
average). The Company was
established on 1887, and its
principal executive offices are located at Allegan, Michigan.
The Company
has
6,200 employees.
Sector:
Healthcare;
Industry:
Biotechnology & Drugs;
Ticker:
PRGO;
Exch:
NASD;
04/04/08
Closing Price:
$39.48
STOCK GRADE (ASG): 45.90 (GOOD)
BUSINESS & FINANCIAL SUMMARY;
KEY STATS
(Yahoo)
EXPANDED BUSINESS DESCRIPTION
(Reuters)
STOCK INFO/RESEARCH
(MSN)
COMPETITORS
(CNN Money)
OWNERSHIP
(MSN)
KEY DEVELOPMENTS
(MSN),
RECENT NEWS
(MSN) &
HEADLINES (Yahoo)
HISTORICAL PRICES (Yahoo)
&
PRICE CHART
(IQChart)
RISK LEVEL: 2
(Less than average)
(MSN)
COMPANY'S WEB SITE
|
Management's Effectiveness (Trailing
12 Mo.) |
. . . |
Return on Equity: |
13.81% |
|
Profitability (Trailing
12 Mo.) |
. . . |
Profit Margin: |
6.70% |
|
Stock's Growth Record
(Trailing
12 Mo.) |
. . . |
Revenue: |
5.90% |
|
. . . |
EPS: |
3.69% |
|
. . . |
Price: |
116.68% |
|
. . . |
Dividend: |
5.95% |
| PE & EPS (Trailing 12 Mo.) |
. . . |
Price/Earnings: |
35.86 |
|
. . . |
Earnings/Share: |
1.10 |
|
Price / Share (Pick Date, Closing Price) |
. . . |
Pick Date 04/04/2008: |
$39.48 |
COMMENT: The stock's pick price (of $39.48) is over the 13- and 50-day EMA price range; i.e.,
higher than
the 13-day EMA price
(of $37.88)
and 50-day EMA (of $35.37) by 4.22% and 11.63% respectively. This suggests that the pick price
is
presently NOT timely NOR advantageous buy
price for the stock. (Note: A stock's EMA price changes with
time).
|
. . . |
|
|
| Price
/ Share (13-day EMA) |
. . . |
04/04/2008: |
$37.88 |
| Price
/ Share (50-day EMA) |
. . . |
04/04/2008: |
$35.37 |
| Price
/ Share (13-day EMA) |
. . . |
|
Current:
|
| Price
/ Share (50-day EMA) |
. . . |
|
Current: |
| Price
/ Share (Current) |
. . . |
Current Price |
Quote |
| Price
/ Share (Historical) |
. . . |
Historical Price |
Quote
|
SPECIAL NOTE:
1. Perrigo's second quarter
profits jumps 63% to $34M.
(Business
Review; March 13, 2008)
2. Perrigo catching a ride on a new $15B generic RX market.
(Detroit
News; February 8 2008)
^Top page
 Consol Energy Inc. (NYSE:
CNX)
is a multi-fuel energy producer and energy services provider primarily serving
the electric power generation industry in the United States. That industry
generates approximately two-thirds of its output by burning coal or gas, the two
fuels produced by Consol. Consol has two principal business units: Coal
and Gas. The principal activities of the Coal unit are mining, preparation and
marketing of steam coal, sold primarily to power generators, and metallurgical
coal, sold to metal and coke producers. During the year ended December 31, 2006,
Consol produced high-Btu bituminous coal from 17 mining complexes in the United
States. Coal produced from Consol's mines has a high-Btu content which creates
more energy
per unit when burned compared to coals with lower Btu content. As a result,
coals with greater Btu content can be more efficient to use. Consol is the
majority shareholder (81.5%) of CNX Gas Corporation. CNX Gas produces
pipeline-quality coalbed methane gas from its coal properties in Pennsylvania,
Virginia and West Virginia and oil and gas from properties in Tennessee and
Virginia. Consol projects that the use of coal and gas to generate electricity
will grow as demand for power increases.
Consol Energy Inc. (NYSE:
CNX)
is a multi-fuel energy producer and energy services provider primarily serving
the electric power generation industry in the United States. That industry
generates approximately two-thirds of its output by burning coal or gas, the two
fuels produced by Consol. Consol has two principal business units: Coal
and Gas. The principal activities of the Coal unit are mining, preparation and
marketing of steam coal, sold primarily to power generators, and metallurgical
coal, sold to metal and coke producers. During the year ended December 31, 2006,
Consol produced high-Btu bituminous coal from 17 mining complexes in the United
States. Coal produced from Consol's mines has a high-Btu content which creates
more energy
per unit when burned compared to coals with lower Btu content. As a result,
coals with greater Btu content can be more efficient to use. Consol is the
majority shareholder (81.5%) of CNX Gas Corporation. CNX Gas produces
pipeline-quality coalbed methane gas from its coal properties in Pennsylvania,
Virginia and West Virginia and oil and gas from properties in Tennessee and
Virginia. Consol projects that the use of coal and gas to generate electricity
will grow as demand for power increases.
The
stock's price gained 15.9% over the past 3 months (vs. the Industry's 53.5%);
50.2% over the past 6 months (vs. the Industry's -19.1%); and 7.8% over
the past 12 months (vs. the Industry's 162.5%). The Company
is classified as a large-cap growth company (with a market cap of $14.22B) that
is rated to outperform the market over the next six months with a Risk Level of
2 (Less than average). The Company was organized on 1991, and its
principal executive offices are located at Pittsburg, Pennsylvania.
The Company
has
7,728 employees.
Sector:
Energy;
Industry:
Coal;
Ticker: CNX;
Exch:
NYSE;
04/11/08
Closing Price:
$75.63
STOCK GRADE (ASG): 47.43 (GOOD)
BUSINESS & FINANCIAL SUMMARY;
KEY STATS
(Yahoo)
EXPANDED BUSINESS DESCRIPTION
(Reuters)
STOCK INFO/RESEARCH
(MSN)
COMPETITORS
(CNN Money)
OWNERSHIP
(MSN)
KEY DEVELOPMENTS
(MSN),
RECENT NEWS
(MSN) &
HEADLINES (Yahoo)
HISTORICAL PRICES (Yahoo)
&
PRICE CHART
(IQChart)
RISK LEVEL: 2
(Less than average)
(MSN)
COMPANY'S WEB SITE
|
Management's Effectiveness (Trailing
12 Mo.) |
. . . |
Return on Equity: |
23.48% |
|
Profitability (Trailing
12 Mo.) |
. . . |
Profit Margin: |
7.51% |
|
Stock's Growth Record
(Trailing
12 Mo.) |
. . . |
Revenue: |
1.27% |
|
. . . |
EPS: |
-33.98% |
|
. . . |
Price: |
77.83% |
|
. . . |
Dividend: |
10.71% |
| PE & EPS (Trailing 12 Mo.) |
. . . |
Price/Earnings: |
53.60 |
|
. . . |
Earnings/Share: |
1.45 |
|
Price / Share (Pick Date, Closing Price) |
. . . |
Pick Date 04/11/2008: |
$75.63 |
COMMENT: The stock's pick price (of $75.63) is over the 13- and 50-day EMA price range; i.e.,
higher than
the 13-day EMA price
(of $73.93)
and 50-day EMA (of $71.86) by 5.59% and 8.63% respectively. This suggests that the pick price
is
presently NOT timely NOR advantageous buy
price for the stock. (Note: A stock's EMA price changes with
time).
|
. . . |
|
|
| Price
/ Share (13-day EMA) |
. . . |
04/11/2008: |
$73.93 |
| Price
/ Share (50-day EMA) |
. . . |
04/11/2008: |
$71.86 |
| Price
/ Share (13-day EMA) |
. . . |
|
Current:
|
| Price
/ Share (50-day EMA) |
. . . |
|
Current: |
| Price
/ Share (Current) |
. . . |
Current Price |
Quote |
| Price
/ Share (Historical) |
. . . |
Historical Price |
Quote
|
SPECIAL NOTE:
1. Coal miners' rating upgraded.
(Seeking
Alpha; March 28, 2008)
2. Standout stocks in mining and
metals.
(Forbes;
March 15, 2008)
3.
Large-cap winners and losers in 2007.
(Forbes;
January 3, 2008)
4.
Coal: More than a black rock..
(Seeking
Alpha; May 22,2007)
5.
Consul Energy is an ACE'S re-pick: It was one of
ACE'S picks for July 2005.
^Top page
 Apache
Corp. (NYSE:
APA)
is an independent energy company that explores for, develops and produces
natural gas, crude oil and natural gas liquids. In
North America, Apache's exploration and production interests are focused
in the Gulf of Mexico, the Gulf Coast, East Texas, the Permian basin, the
Anadarko basin and the Western Sedimentary basin of Canada. Outside of North
America, Apache have exploration and production interests onshore Egypt, offshore Western Australia, offshore the United Kingdom in the North Sea, and onshore Argentina. Apache's future growth in the
United States is more likely to be achieved through a combination of drilling
and acquisitions, rather than through drilling activity alone. Apache
Corp. (NYSE:
APA)
is an independent energy company that explores for, develops and produces
natural gas, crude oil and natural gas liquids. In
North America, Apache's exploration and production interests are focused
in the Gulf of Mexico, the Gulf Coast, East Texas, the Permian basin, the
Anadarko basin and the Western Sedimentary basin of Canada. Outside of North
America, Apache have exploration and production interests onshore Egypt, offshore Western Australia, offshore the United Kingdom in the North Sea, and onshore Argentina. Apache's future growth in the
United States is more likely to be achieved through a combination of drilling
and acquisitions, rather than through drilling activity alone.
The
stock's price gained 48.7% over the past 3 months (vs. the Industry's 102.4%);
52.7% over the past 6 months (vs. the Industry's 77.6%); and 92.5% over
the past 12 months (vs. the Industry's 208.9%). The Company
is classified as a large-cap growth company (with a market cap of $47.45) that
is rated to outperform the market over the next six months with a Risk Level of
3 (average). The Company was formed on 1954, and its
principal executive offices are located at Houston, Texas.
The Company
has
3,521 employees.
Sector:
Energy;
Industry: Oil & Gas Operations;
Ticker: APA;
Exch:
NYSE;
04/18/08
Closing Price:
$142.51
STOCK GRADE (ASG): 55.08 (VERY GOOD)
BUSINESS & FINANCIAL SUMMARY;
KEY STATS
(Yahoo)
EXPANDED BUSINESS DESCRIPTION
(Reuters)
STOCK INFO/RESEARCH
(MSN)
COMPETITORS
(CNN Money)
OWNERSHIP
(MSN)
KEY DEVELOPMENTS
(MSN),
RECENT NEWS
(MSN) &
HEADLINES (Yahoo)
HISTORICAL PRICES (Yahoo)
&
PRICE CHART
(IQChart)
RISK LEVEL: 3
(Average)
(MSN)
COMPANY'S WEB SITE
|
Management's Effectiveness (Trailing
12 Mo.) |
. . . |
Return on Equity: |
19.69% |
|
Profitability (Trailing
12 Mo.) |
. . . |
Profit Margin: |
28.21% |
|
Stock's Growth Record
(Trailing
12 Mo.) |
. . . |
Revenue: |
20.38% |
|
. . . |
EPS: |
9.75% |
|
. . . |
Price: |
92.50% |
|
. . . |
Dividend: |
20.00% |
| PE & EPS (Trailing 12 Mo.) |
. . . |
Price/Earnings: |
16.99 |
|
. . . |
Earnings/Share: |
8.39 |
|
Price / Share (Pick Date, Closing Price) |
. . . |
Pick Date 04/18/2008: |
$142.51 |
COMMENT: The stock's pick price (of $142.51) is over the 13- and 50-day EMA price range; i.e.,
higher than
the 13-day EMA price
(of $133.35)
and 50-day EMA (of $120.25) by 6.81% and 18.51% respectively. This suggests that the pick price
is
presently NOT timely NOR advantageous buy
price for the stock. (Note: A stock's EMA price changes with
time).
|
. . . |
|
|
| Price
/ Share (13-day EMA) |
. . . |
04/18/2008: |
$133.35 |
| Price
/ Share (50-day EMA) |
. . . |
04/18/2008: |
$120.25 |
| Price
/ Share (13-day EMA) |
. . . |
|
Current:
|
| Price
/ Share (50-day EMA) |
. . . |
|
Current: |
| Price
/ Share (Current) |
. . . |
Current Price |
Quote |
| Price
/ Share (Historical) |
. . . |
Historical Price |
Quote
|
SPECIAL NOTE:
1. The energy sector's gains
outpace broad market.
(MarketWatch;
April 7, 2008)
2. Thriving on the crude's surge.
(Forbes; April 1, 2008)
3.
Top five large-cap stocks.
(TheStreet.com;
March 19, 2008)
4.
Apache doubles its 2007 4th quarter earnings.
(SmartBriefs;
February 8, 2008)
^Top page
 Cleveland-Cliffs Inc. (NYSE:
CLF)
is the largest producer
of iron ore pellets in North America. The Company sell substantially all
of its pellets to integrated
steel companies in the United States and Canada. Through a majority acquisition
of Portman, an iron ore mining company in Australia, the Company
increased its customer base in China and Japan and established a presence in the
Australian mining industry. The Company is organized into two
operating and reporting segments: North America and Australia. The North America
segment is comprised of the mining operations in the United States and Canada.
The Australia segment is comprised of our 80.4 percent Portman interest in
Western Australia.
Cleveland-Cliffs Inc. (NYSE:
CLF)
is the largest producer
of iron ore pellets in North America. The Company sell substantially all
of its pellets to integrated
steel companies in the United States and Canada. Through a majority acquisition
of Portman, an iron ore mining company in Australia, the Company
increased its customer base in China and Japan and established a presence in the
Australian mining industry. The Company is organized into two
operating and reporting segments: North America and Australia. The North America
segment is comprised of the mining operations in the United States and Canada.
The Australia segment is comprised of our 80.4 percent Portman interest in
Western Australia.
The
stock's price gained 70.5% over the past 3 months (vs. the Industry's 146.3%);
65.3% over the past 6 months (vs. the Industry's 80.6%); and 135.3% over
the past 12 months (vs. the Industry's 362.4). The Company
is classified as a mid-cap growth company (with a market cap of $7.38B) that
is rated to outperform the market over the next six months with a Risk Level of
3 (average). The Company was founded on 18.47, and its
principal executive offices are located at Cleveland, Ohio.
The Company
has
5,298 employees.
Sector:
Basic Materials;
Industry: Metal Mining;
Ticker: CLF;
Exch:
NYSE;
04/25/08
Closing Price:
$163.32
STOCK GRADE (ASG): 48.96 (GOOD)
BUSINESS & FINANCIAL SUMMARY;
KEY STATS
(Yahoo)
EXPANDED BUSINESS DESCRIPTION
(Reuters)
STOCK INFO/RESEARCH
(MSN)
COMPETITORS
(CNN Money)
OWNERSHIP
(MSN)
KEY DEVELOPMENTS
(MSN),
RECENT NEWS
(MSN) &
HEADLINES (Yahoo)
HISTORICAL PRICES (Yahoo)
&
PRICE CHART
(IQChart)
RISK LEVEL: 3
(Average)
(MSN)
COMPANY'S WEB SITE
|
Management's Effectiveness (Trailing
12 Mo.) |
. . . |
Return on Equity: |
24.35% |
|
Profitability (Trailing
12 Mo.) |
. . . |
Profit Margin: |
11.87% |
|
Stock's Growth Record
(Trailing
12 Mo.) |
. . . |
Revenue: |
18.40% |
|
. . . |
EPS: |
5.14% |
|
. . . |
Price: |
135.30% |
|
. . . |
Dividend: |
5.26% |
| PE & EPS (Trailing 12 Mo.) |
. . . |
Price/Earnings: |
16.99 |
|
. . . |
Earnings/Share: |
31.76 |
|
Price / Share (Pick Date, Closing Price) |
. . . |
Pick Date 04/25/2008: |
$163.32 |
COMMENT: The stock's pick price (of $163.32) is over the 13- and 50-day EMA price range; i.e.,
higher than
the 13-day EMA price
(of $153.64)
and 50-day EMA (of $132.59) by 6.30% and 23.17% respectively. This suggests that the pick price
is
presently NOT timely NOR advantageous buy
price for the stock. (Note: A stock's EMA price changes with
time).
|
. . . |
|
|
| Price
/ Share (13-day EMA) |
. . . |
04/25/2008: |
$153.64 |
| Price
/ Share (50-day EMA) |
. . . |
04/25/2008: |
$132.59 |
| Price
/ Share (13-day EMA) |
. . . |
|
Current:
|
| Price
/ Share (50-day EMA) |
. . . |
|
Current: |
| Price
/ Share (Current) |
. . . |
Current Price |
Quote |
| Price
/ Share (Historical) |
. . . |
Historical Price |
Quote
|
SPECIAL NOTE:
1. Cleveland Cliffs rocks.
(Schaeffer's Research; April 23, 2008)
2. Cleveland-Cliffs Inc. reports
4th-quarter and full-year 2007 results.
(Business
Wire; February 21, 2008)
3.
Cleveland-Cliffs' mining is shining.
(SeekingAlpha;
October 19, 2007)
^Top page
|
May 2008 Stock
Picks |
| Stock Name |
SYM |
Exch. |
Sector |
Industry |
Date Picked |
Pick Price
(per share) |
ASG |
|
EOG Resources Inc. |
EOG |
NYSE |
Energy
|
Oil & Gas Operations |
05/02/08 |
$127.75 |
54.32 (Very Good) |
|
Darling International Inc. |
DAR |
AMEX |
Consumer/Non-Cyclical
|
Food Processing |
05/09/08 |
$16.18 |
45.90 (Good) |
|
Agrium Inc. |
AGU |
NYSE |
Basic Materials
|
Chemical Manufacturing |
05/16/08 |
$16.18 |
50.49 (Very Good) |
|
Bucyrus International Inc. |
BUCY |
NASD |
Capital Goods
|
Construction & Agricultural Machinery |
05/23/08 |
$132.16 |
51.26 (Very Good) |
|
Southwestern Energy Co. |
SWN |
NYSE |
Energy
|
Oil & Gas Operations |
05/30/08 |
$44.34 |
48.20 (Good) |
 EOG Resources Inc. (NYSE:
EOG)
is one of
the largest independent (non-integrated) oil and natural gas companies in the
United States. EOG
explores for, develops, produces and markets natural gas and crude oil in major
producing basins in the United States, Canada, offshore Trinidad, the United
Kingdom North Sea and select other international areas. As of December 31, 2006, EOG's total estimated net proved reserves were 6,802 billion cubic feet
equivalent (Bcfe), of which 6,095 billion cubic feet (Bcf) were natural gas
reserves and 118 million barrels (MMBbl), or 707 Bcfe, were crude oil,
condensate and natural gas liquids reserves. On the same latter date,
approximately 60% of EOG's reserves (on a natural gas equivalent basis) were
located in the United States, 20% in Canada and 20% in Trinidad.
EOG Resources Inc. (NYSE:
EOG)
is one of
the largest independent (non-integrated) oil and natural gas companies in the
United States. EOG
explores for, develops, produces and markets natural gas and crude oil in major
producing basins in the United States, Canada, offshore Trinidad, the United
Kingdom North Sea and select other international areas. As of December 31, 2006, EOG's total estimated net proved reserves were 6,802 billion cubic feet
equivalent (Bcfe), of which 6,095 billion cubic feet (Bcf) were natural gas
reserves and 118 million barrels (MMBbl), or 707 Bcfe, were crude oil,
condensate and natural gas liquids reserves. On the same latter date,
approximately 60% of EOG's reserves (on a natural gas equivalent basis) were
located in the United States, 20% in Canada and 20% in Trinidad.
The
stock's price gained 51.0% over the past 3 months (vs. the Industry's 93.7%);
49.3% over the past 6 months (vs. the Industry's 50.5%); and 74.8% over
the past 12 months (vs. the Industry's 198.6%). The Company
is classified as a large-cap growth company (with a market cap of $31.71B) that
is rated to outperform the market over the next six months with a Risk Level of
2 (Less than average). The Company was organized on 1985, and its
principal executive offices are located at Houston texas.
The Company
has
1800 employees.
Sector:
Energy;
Industry:
Oil & Gas OPerations;
Ticker: EOG;
Exch:
NYSE;
05/02/08
Closing Price:
$127.75
STOCK GRADE (ASG): 54.32 (VERY GOOD)

BUSINESS & FINANCIAL SUMMARY;
KEY STATS
(Yahoo)
EXPANDED BUSINESS DESCRIPTION
(Reuters)
STOCK INFO/RESEARCH
(MSN)
COMPETITORS
(CNN Money)
OWNERSHIP
(MSN)
KEY DEVELOPMENTS
(MSN),
RECENT NEWS
(MSN) &
HEADLINES (Yahoo)
HISTORICAL PRICES (Yahoo)
&
PRICE CHART
(IQChart)
RISK LEVEL: 2
(Less than average)
(MSN)
COMPANY'S WEB SITE
|
Management's Effectiveness (Trailing
12 Mo.) |
. . . |
Return on Equity: |
17.31% |
|
Profitability (Trailing
12 Mo.) |
. . . |
Profit Margin: |
26.99% |
|
Stock's Growth Record
(Trailing
12 Mo.) |
. . . |
Revenue: |
7.11% |
|
. . . |
EPS: |
-16.48% |
|
. . . |
Price: |
82.21% |
|
. . . |
Dividend: |
50.00% |
| PE & EPS (Trailing 12 Mo.) |
. . . |
Price/Earnings: |
29.35 |
|
. . . |
Earnings/Share: |
4.37 |
|
Price / Share (Pick Date, Closing Price) |
. . . |
Pick Date 05/02/2008: |
$127.75 |
COMMENT: The stock's pick price (of $127.75) is under the 13- and over the 50-day EMA price range; i.e.,
lower than
the 13-day EMA price
(of $130.55)
and higher than the 50-day EMA (of $121.78) by -2.14% and 4.90% respectively. This suggests that the pick price
IS
presently timely AND advantageous buy
price for the stock. (Note: A stock's EMA price changes with
time).
|
. . . |
|
|
| Price
/ Share (13-day EMA) |
. . . |
05/02/2008: |
$130.55 |
| Price
/ Share (50-day EMA) |
. . . |
05/02/2008: |
$121.78 |
| Price
/ Share (13-day EMA) |
. . . |
|
Current:
|
| Price
/ Share (50-day EMA) |
. . . |
|
Current: |
| Price
/ Share (Current) |
. . . |
Current Price |
Quote |
| Price
/ Share (Historical) |
. . . |
Historical Price |
Quote
|
SPECIAL NOTE:
1.
Amex Natural Gas Index hits all-time high.
(MarketWatch;
February 28, 2008)
2.
EOG expects 36% production growth in North Dakota.
(SmartBrief;
February 21, 2008)
3. EOG
strikes oil.
(Forbes;
February 2, 2008)
4. EOG Resources is an ACE'S re-pick:
EOG was one of
ACE'S picks for December 2000.
As of May 2, 2008, the stock had a 7.33-year gain of 425% (or about 57.99%
annually). NOTE: Stocks historical prices were based on
Yahoo Finance's price table.
^Top page
 Darling International Inc. (AMEX: DAR)
is
a leading provider of rendering, recycling and recovery solutions to the
nation’s food industry. The Company collects and recycles animal
by-products and used cooking oil from food service establishments and provides
grease trap cleaning services to many of the same establishments. The Company
processes raw materials at 39 facilities located throughout the United States
into finished products such as protein (primarily meat and bone meal), tallow
(primarily bleachable fancy tallow), yellow grease and
hides. The
Company sells these products nationally and internationally, primarily to
producers of oleo-chemicals, bio-fuels, soaps, pet foods, leather goods and
livestock feed for use as ingredients in their products or for further
processing. Darling International Inc. (AMEX: DAR)
is
a leading provider of rendering, recycling and recovery solutions to the
nation’s food industry. The Company collects and recycles animal
by-products and used cooking oil from food service establishments and provides
grease trap cleaning services to many of the same establishments. The Company
processes raw materials at 39 facilities located throughout the United States
into finished products such as protein (primarily meat and bone meal), tallow
(primarily bleachable fancy tallow), yellow grease and
hides. The
Company sells these products nationally and internationally, primarily to
producers of oleo-chemicals, bio-fuels, soaps, pet foods, leather goods and
livestock feed for use as ingredients in their products or for further
processing.
The
stock's price gained 32.8% over the past 3 months (vs. the Industry's -4.4%);
62.3% over the past 6 months (vs. the Industry's -2.1%); and 95.9% over
the past 12 months (vs. the Industry's 21.6%). The Company
is classified as a mid-cap growth company (with a market cap of $1.32B) that
is rated to outperform the market over the next six months with a Risk Level of
3 (Average). The Company was incorporated in Delaware in 1962 under the
name “Darling-Delaware Company, Inc.”. The Company's
principal executive offices are located at Irving, Texas.
The Company
has
1880 employees.
Sector:
Consumer/Non-Cyclical;
Industry: Food Processing;
Ticker: DAR;
Exch: AMEX;
05/09/08
Closing Price: $16.18
STOCK GRADE (ASG): 45.90 (GOOD)
BUSINESS & FINANCIAL SUMMARY;
KEY STATS
(Yahoo)
EXPANDED BUSINESS DESCRIPTION
(Reuters)
STOCK INFO/RESEARCH
(MSN)
COMPETITORS
(CNN Money)
OWNERSHIP
(MSN)
KEY DEVELOPMENTS
(MSN),
RECENT NEWS
(MSN) &
HEADLINES (Yahoo)
HISTORICAL PRICES (Yahoo)
&
PRICE CHART
(IQChart)
RISK LEVEL: 3
(Average)
(MSN)
COMPANY'S WEB SITE
|
Management's Effectiveness (Trailing
12 Mo.) |
. . . |
Return on Equity: |
25.85% |
|
Profitability (Trailing
12 Mo.) |
. . . |
Profit Margin: |
7.06% |
|
Stock's Growth Record
(Trailing
12 Mo.) |
. . . |
Revenue: |
58.56% |
|
. . . |
EPS: |
719.32% |
|
. . . |
Price: |
101.96% |
|
. . . |
Dividend: |
NA |
| PE & EPS (Trailing 12 Mo.) |
. . . |
Price/Earnings: |
29.10 |
|
. . . |
Earnings/Share: |
0.56 |
|
Price / Share (Pick Date, Closing Price) |
. . . |
Pick Date 05/09/2008: |
$16.18 |
COMMENT: The stock's pick price (of $16.18) is over 13- and over the 50-day EMA price range; i.e.,
higher than
the 13-day EMA price
(of $15.51)
and higher than the 50-day EMA (of $14.22) by 15.52% and 14.22% respectively. This suggests that the pick price
is presently
NOT timely NOR advantageous buy
price for the stock. (Note: A stock's EMA price changes with
time).
|
. . . |
|
|
| Price
/ Share (13-day EMA) |
. . . |
05/09/2008: |
$15.51 |
| Price
/ Share (50-day EMA) |
. . . |
05/09/2008: |
$14.22 |
| Price
/ Share (13-day EMA) |
. . . |
|
Current:
|
| Price
/ Share (50-day EMA) |
. . . |
|
Current: |
| Price
/ Share (Current) |
. . . |
Current Price |
Quote |
| Price
/ Share (Historical) |
. . . |
Historical Price |
Quote
|
SPECIAL NOTE:
1.
Darling International Inc. have record results in Fiscal Year 2007.
(Smartbrief;
February 27, 2008)
2.
Technical trading alert: Darling International Inc.
(StockProfit.com;
February 4, 2008)
^Top page
 Agrium Inc. (NYSE:
AGU)
is
a global producer and marketer of agricultural nutrients and industrial products
and a major retail supplier of agriculture products and services in both North
America and Argentina. The Company is one of the top two nitrogen
producers in the world with approximately three percent of the nitrogen market.
The Company produces a full range of fertilizers. Nitrogen-based
fertilizers are produced in Alberta, Canada at five plants. Sulphur and
phosphate-based fertilizers are also produced which utilizes phosphate ore from
Agrium’s phosphate mine located at Ontario. In the United States, the Company
owns and operates five nitrogen-based fertilizer production plants at Nebraska,
Texas, Alaska, Washington and California and one phosphate-based fertilizer
production facility at Idaho. Agrium Inc. (NYSE:
AGU)
is
a global producer and marketer of agricultural nutrients and industrial products
and a major retail supplier of agriculture products and services in both North
America and Argentina. The Company is one of the top two nitrogen
producers in the world with approximately three percent of the nitrogen market.
The Company produces a full range of fertilizers. Nitrogen-based
fertilizers are produced in Alberta, Canada at five plants. Sulphur and
phosphate-based fertilizers are also produced which utilizes phosphate ore from
Agrium’s phosphate mine located at Ontario. In the United States, the Company
owns and operates five nitrogen-based fertilizer production plants at Nebraska,
Texas, Alaska, Washington and California and one phosphate-based fertilizer
production facility at Idaho.
The
stock's price gained 37.3% over the past 3 months (vs. the Industry's 91.5%);
60.7% over the past 6 months (vs. the Industry's255.6%); and 134.4% over
the past 12 months (vs. the Industry's 705.4%). The Company
is classified as a large-cap growth company (with a market cap of $14.16B) that
is rated to outperform the market over the next six months with a Risk Level of
3 (Average). The Company was formed in 1993 from the reorganization of
the fertilizer division of Cominco Ltd. and the acquisition of the fertilizer
assets of Alberta Energy Company Ltd. The Company's
principal executive offices are located at Alberta, Calgary.
The Company
has
6,618 employees.
Sector:
Basic Materials;
Industry:
Chemical Manufacturing;
Ticker: AGU;
Exch: NYSE;
05/16/08
Closing Price:
$89.64
STOCK GRADE (ASG): 50.49 (VERY GOOD)
BUSINESS & FINANCIAL SUMMARY;
KEY STATS
(Yahoo)
EXPANDED BUSINESS DESCRIPTION
(Reuters)
STOCK INFO/RESEARCH
(MSN)
COMPETITORS
(CNN Money)
OWNERSHIP
(MSN)
KEY DEVELOPMENTS
(MSN),
RECENT NEWS
(MSN) &
HEADLINES (Yahoo)
HISTORICAL PRICES (Yahoo)
&
PRICE CHART
(IQChart)
RISK LEVEL: 3
(Average)
(MSN)
COMPANY'S WEB SITE
|
Management's Effectiveness (Trailing
12 Mo.) |
. . . |
Return on Equity: |
28.53% |
|
Profitability (Trailing
12 Mo.) |
. . . |
Profit Margin: |
11.65% |
|
Stock's Growth Record
(Trailing
12 Mo.) |
. . . |
Revenue: |
25.69% |
|
. . . |
EPS: |
891.91% |
|
. . . |
Price: |
134.41% |
|
. . . |
Dividend: |
NA |
| PE & EPS (Trailing 12 Mo.) |
. . . |
Price/Earnings: |
19.61 |
|
. . . |
Earnings/Share: |
4.54 |
|
Price / Share (Pick Date, Closing Price) |
. . . |
Pick Date 05/16/2008: |
$89.64 |
COMMENT: The stock's pick price (of $89.64 is over 13- and the 50-day EMA price range; i.e.,
higher than
the 13-day EMA price
(of $86.09)
and higher than the 50-day EMA (of $78.09) by 4.13% and 13.77% respectively. This suggests that the pick price
is presently
NOT timely NOR advantageous buy
price for the stock. (Note: A stock's EMA price changes with
time).
|
. . . |
|
|
| Price
/ Share (13-day EMA) |
. . . |
05/16/2008: |
$86.09 |
| Price
/ Share (50-day EMA) |
. . . |
05/16/2008: |
$78.79 |
| Price
/ Share (13-day EMA) |
. . . |
|
Current:
|
| Price
/ Share (50-day EMA) |
. . . |
|
Current: |
| Price
/ Share (Current) |
. . . |
Current Price |
Quote |
| Price
/ Share (Historical) |
. . . |
Historical Price |
Quote
|
SPECIAL NOTE:
1. Fertilizer prices doubled
in the last few months.
(Tennessean.com;
May 7 2008)
2.
Agrium had record 2008 1st quarter earnings.
(SmartBrief;
May 2 2008)
3.
Agrium hits paydirt.
(Forbes;
My 2, 2008)
4.
Major fertilizer producers reaps huge profits.
(International
Business Times; April 4, 2008)
5.
Agri stock leaders on bullish uptrends.
(SeekingAlpha;
March 17, 2008)
6.
A new "golden age" of agriculture.
(TheStar.com;
March 2, 2008)
^Top page
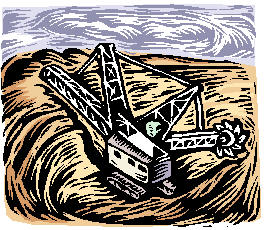 Bucyrus International Inc. (NASD:
BUCY)
design,
manufacture and market draglines, electric mining shovels and rotary blasthole
drills used for surface mining and provide the aftermarket replacement parts and
service for these machines. The Company have a large worldwide installed base of
the latter equipment and are the leading market provider of
draglines and large rotary blasthole drills. The Company's products are sold to
customers throughout the world. Growth in the industry is driven by increased
demand for surface mined commodities such as copper (especially in South
America), oil sands (Canada) and coal (China, the United States, India,
Australia, South African and Russia).
Bucyrus International Inc. (NASD:
BUCY)
design,
manufacture and market draglines, electric mining shovels and rotary blasthole
drills used for surface mining and provide the aftermarket replacement parts and
service for these machines. The Company have a large worldwide installed base of
the latter equipment and are the leading market provider of
draglines and large rotary blasthole drills. The Company's products are sold to
customers throughout the world. Growth in the industry is driven by increased
demand for surface mined commodities such as copper (especially in South
America), oil sands (Canada) and coal (China, the United States, India,
Australia, South African and Russia).
The
stock's price gained 29.6% over the past 3 months (vs. the Industry's 25.2%);
59.4% over the past 6 months (vs. the Industry's 55.5%); and 107.7% over
the past 12 months (vs. the Industry's 108.5%). The Company
is classified as a mid-cap growth company (with a market cap of $4.91B) that
is rated to outperform the market over the next six months with a Risk Level of
3 (Average). The Company was incorporated in 1927 as the successor to a business
that began producing excavation machines in 1880. The Company's
principal executive offices are located at South Milwaukee, Wisconsin.
The Company
has
6,050 employees.
Sector:
Capital Goods;
Industry:
Construction & Agricultural Machinery;
Ticker: BUCY;
Exch:
NASD;
05/23/08
Closing Price:
$132.16
STOCK GRADE (ASG): 51.26 (VERY GOOD)
BUSINESS & FINANCIAL SUMMARY;
KEY STATS
(Yahoo)
EXPANDED BUSINESS DESCRIPTION
(Reuters)
STOCK INFO/RESEARCH
(MSN)
COMPETITORS
(CNN Money)
OWNERSHIP
(MSN)
KEY DEVELOPMENTS
(MSN),
RECENT NEWS
(MSN) &
HEADLINES (Yahoo)
HISTORICAL PRICES (Yahoo)
&
PRICE CHART
(IQChart)
RISK LEVEL: 3
(Average)
(MSN)
COMPANY'S WEB SITE
|
Management's Effectiveness (Trailing
12 Mo.) |
. . . |
Return on Equity: |
27.33% |
|
Profitability (Trailing
12 Mo.) |
. . . |
Profit Margin: |
8.21% |
|
Stock's Growth Record
(Trailing
12 Mo.) |
. . . |
Revenue: |
118.60% |
|
. . . |
EPS: |
72.63% |
|
. . . |
Price: |
108.27% |
|
. . . |
Dividend: |
NA |
| PE & EPS (Trailing 12 Mo.) |
. . . |
Price/Earnings: |
32.69 |
|
. . . |
Earnings/Share: |
4.32 |
|
Price / Share (Pick Date, Closing Price) |
. . . |
Pick Date 05/23/2008: |
$132.16 |
COMMENT: The stock's pick price (of $132.16 is under the 13-day EMA and
over 50-day EMA price range; i.e.,
lower than
the 13-day EMA price
(of $133.23)
and higher than the 50-day EMA (of $122.41) by -0.80% and 7.96% respectively. This suggests that the pick price
IS presently
timely AND advantageous buy
price for the stock. (Note: A stock's EMA price changes with
time. SEE also: ACE'S research report "ACE'S
"Timely"
& "Untimely" Stocks - How to Use and How They Perform" ).
|
. . . |
|
|
| Price
/ Share (13-day EMA) |
. . . |
05/23/2008: |
$133.23 |
| Price
/ Share (50-day EMA) |
. . . |
05/23/2008: |
$122.41 |
| Price
/ Share (13-day EMA) |
. . . |
|
Current:
|
| Price
/ Share (50-day EMA) |
. . . |
|
Current: |
| Price
/ Share (Current) |
. . . |
Current Price |
Quote |
| Price
/ Share (Historical) |
. . . |
Historical Price |
Quote
|
SPECIAL NOTE:
1. 50 best manufacturing
companies.
(Industry
Week; May 23, 2008)
2.
Excavating Bucyrus.
(RTT
News; May 14, 2008)
3.
Bucyrus poised to take advantage of growing commodities demand.
(Forbes;
May 5, 2008)
4.
Bucyrus mining for profits.
(JSOnline;
April 25 2008)
5.
Strong sales growth nearly doubles Bucyrus 1st quarter 2008 profit.
(RTT
News; April 24, 2008)
^Top page
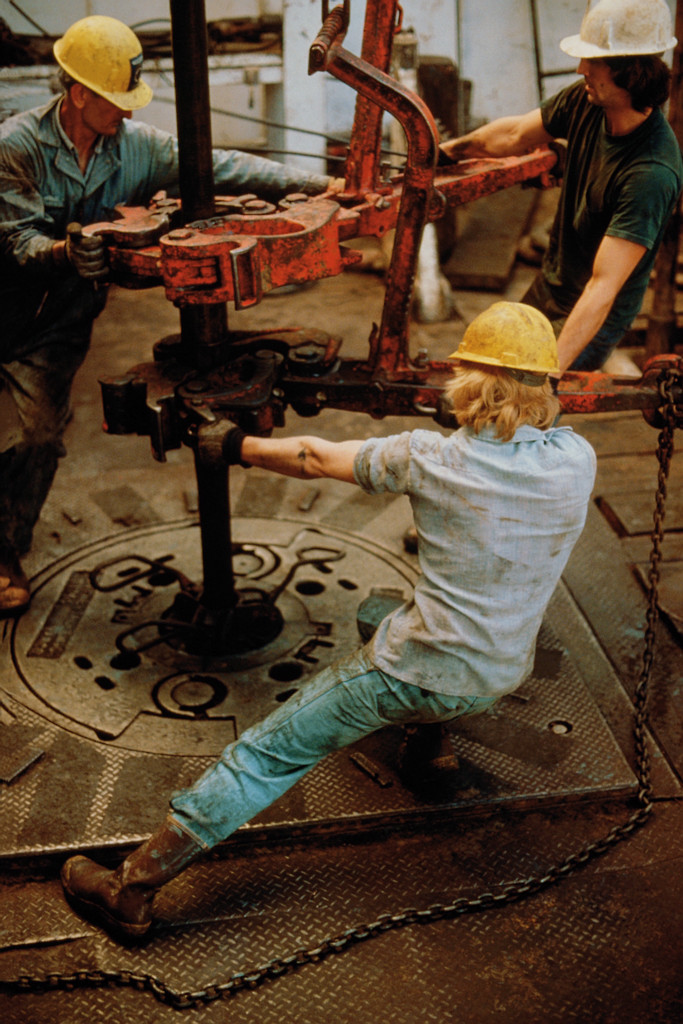 Southwestern Energy Co. NYSE:
SWN)
is an independent energy company primarily engaged in the exploration for and
production of natural gas within the United States. The Company operate
principally in three segments – Exploration and Production, or E&P, Midstream
Services and Natural Gas Distribution. Exploration and Production - the
Company's primary business whose operations are primarily conducted through its
wholly-owned subsidiaries. Midstream Services - generates revenue from
gathering fees associated with the transportation of natural gas to market and
through the marketing of its gas production and some third-party natural gas.
Natural Gas Distribution - operates integrated natural gas distribution systems
in northern Arkansas serving approximately 152,000 retail customers. Southwestern Energy Co. NYSE:
SWN)
is an independent energy company primarily engaged in the exploration for and
production of natural gas within the United States. The Company operate
principally in three segments – Exploration and Production, or E&P, Midstream
Services and Natural Gas Distribution. Exploration and Production - the
Company's primary business whose operations are primarily conducted through its
wholly-owned subsidiaries. Midstream Services - generates revenue from
gathering fees associated with the transportation of natural gas to market and
through the marketing of its gas production and some third-party natural gas.
Natural Gas Distribution - operates integrated natural gas distribution systems
in northern Arkansas serving approximately 152,000 retail customers.
The
stock's price gained 36.0% over the past 3 months (vs. the Industry's 69.7%);
78.2% over the past 6 months (vs. the Industry's 112.1%); and 86.3% over
the past 12 months (vs. the Industry's 189.9%). The Company
is classified as a large-cap growth company (with a market cap of $15.16B) that
is rated to outperform the market over the next six months with a Risk Level of
3 (Average). The Company was founded in 1929. The Company's
principal executive offices are located at Houston, Texas.
The Company
has
1,521 employees.
Sector: Energy; Industry:
Oil & Gas Operations;
Ticker: SWN;
Exch:
NYSE;
05/30/08
Closing Price:
$44.34
STOCK GRADE (ASG): 48.20 (GOOD)
BUSINESS & FINANCIAL SUMMARY;
KEY STATS
(Yahoo)
EXPANDED BUSINESS DESCRIPTION
(Reuters)
STOCK INFO/RESEARCH
(MSN)
COMPETITORS
(CNN Money)
OWNERSHIP
(MSN)
KEY DEVELOPMENTS
(MSN),
RECENT NEWS
(MSN) &
HEADLINES (Yahoo)
HISTORICAL PRICES (Yahoo)
&
PRICE CHART
(IQChart)
RISK LEVEL: 3
(Average)
(MSN)
COMPANY'S WEB SITE
|
Management's Effectiveness (Trailing
12 Mo.) |
. . . |
Return on Equity: |
9.84% |
|
Profitability (Trailing
12 Mo.) |
. . . |
Profit Margin: |
13.75% |
|
Stock's Growth Record
(Trailing
12 Mo.) |
. . . |
Revenue: |
64.48% |
|
. . . |
EPS: |
34.09% |
|
. . . |
Price: |
99.38% |
|
. . . |
Dividend: |
NA |
| PE & EPS (Trailing 12 Mo.) |
. . . |
Price/Earnings: |
65.23 |
|
. . . |
Earnings/Share: |
0.65 |
|
Price / Share (Pick Date, Closing Price) |
. . . |
Pick Date 05/30/2008: |
$44.34 |
COMMENT: The stock's pick price (of $44.34 is under the 13-day EMA and
over 50-day EMA price range; i.e.,
lower than
the 13-day EMA price
(of $44.63)
and higher than the 50-day EMA (of $40.87) by -0.65% and 8.50% respectively. This suggests that the pick price
IS presently
timely AND advantageous buy
price for the stock. (Note: A stock's EMA price changes with
time. SEE also: ACE'S research report "ACE'S
"Timely"
& "Untimely" Stocks - How to Use and How They Perform" ).
|
. . . |
|
|
| Price
/ Share (13-day EMA) |
. . . |
05/30/2008: |
$44.63 |
| Price
/ Share (50-day EMA) |
. . . |
05/30/2008: |
$40.87 |
| Price
/ Share (13-day EMA) |
. . . |
|
Current:
|
| Price
/ Share (50-day EMA) |
. . . |
|
Current: |
| Price
/ Share (Current) |
. . . |
Current Price |
Quote |
| Price
/ Share (Historical) |
. . . |
Historical Price |
Quote
|
SPECIAL NOTE:
1. Block Traders' favorite
energy stocks.
(Forbes;
May 30, 2008)
2.
Southwestern Energy's valuation downgraded.
(RTT News; May 30, 2008)
3.
Grabbing a piece of the action on energy stocks.
(Business Week; May 27, 2008)
4.
Southwestern Energy's record financial and operating results for 1Q of 2008.
(MarketWatch;
April 25, 2008)
5. Southwestern Energy is an ACE'S re-pick. SWN was one of
ACE'S picks for April 2004
and June 2005. April 2004's SWN had a
12-month gain of 149.83%, and June 2005's SWN had a 12-month gain of 61.80%.
From April 1, 2004 to April 1, 2008, SWN had a 4-year gain of 1,033.22% (or an
averaged annual gain of 258.31%. (NOTE: Stocks historical prices were extracted
from
Yahoo Finance's price table.
^Top page
|
June
2008 Stock Picks |
| Stock Name |
SYM |
Exch. |
Sector |
Industry |
Date Picked |
Pick Price
(per share) |
ASG |
|
Hess Corp. |
HES |
NYSE |
Energy
|
Oil & Gas -
Integrated |
06/06/08 |
$123.92 |
52.02 (Very Good) |
|
Sociedad Quimica Y Minera AD |
SQM |
NYSE |
Basic Materials
|
Chemical Manufacturing |
06/13/08 |
$45.45 |
49.73 (Good) |
|
Cabot Oil & Gas Corp. |
COG |
NYSE |
Energy
|
Oil & Gas Operations |
06/20/08 |
$65.40 |
51.26 (Very Good) |
|
Gerdau S.A. ADR |
GGB |
NYSE |
Basic Materials
|
Iron & Steel |
06/27/08 |
$23.12 |
44.37 (Good) |
 Hess Corp. (NYSE:
HES)
and its
subsidiaries (collectively referred to as “Hess”) is a global integrated
energy company that operates in two segments,
Exploration and Production (E&P) and Marketing and Refining (M&R). The E&P
segment explores for, develops, produces, purchases, transports and
sells crude oil and natural gas. These exploration and production activities
take place principally in Algeria, Australia, Azerbaijan, Brazil, Denmark,
Egypt, Equatorial Guinea, Gabon, Ghana, Indonesia, Libya, Malaysia, Norway,
Russia, Thailand, the United Kingdom and the United States. The M&R segment
manufactures, purchases, transports, trades and markets refined petroleum
products, natural gas and electricity. Hess owns a refining facility,
terminals and retail gasoline stations, most of which include convenience
stores, located on the East Coast of the United States. Hess Corp. (NYSE:
HES)
and its
subsidiaries (collectively referred to as “Hess”) is a global integrated
energy company that operates in two segments,
Exploration and Production (E&P) and Marketing and Refining (M&R). The E&P
segment explores for, develops, produces, purchases, transports and
sells crude oil and natural gas. These exploration and production activities
take place principally in Algeria, Australia, Azerbaijan, Brazil, Denmark,
Egypt, Equatorial Guinea, Gabon, Ghana, Indonesia, Libya, Malaysia, Norway,
Russia, Thailand, the United Kingdom and the United States. The M&R segment
manufactures, purchases, transports, trades and markets refined petroleum
products, natural gas and electricity. Hess owns a refining facility,
terminals and retail gasoline stations, most of which include convenience
stores, located on the East Coast of the United States.
The
stock's price gained 35.2% over the past 3 months (vs. the Industry's 42.5%);
57.6% over the past 6 months (vs. the Industry's 43.5%); and 110.0% over
the past 12 months (vs. the Industry's 111.9%). The Company
is classified as a large-cap value company (with a market cap of $40.02B) that
is rated to outperform the market over the next six months with a Risk Level of
3 (Average). The Company was founded in 1920. The Company's
principal executive offices are located at New York, New York.
The Company
has
13,300 employees.
Sector: Energy;
Industry:
Oil & Gas - Integrated;
Ticker: HES;
Exch:
NYSE;
06/06/08
Closing Price: $123.92
STOCK GRADE (ASG): 52.02 (VERY GOOD)
BUSINESS & FINANCIAL SUMMARY;
KEY STATS
(Yahoo)
EXPANDED BUSINESS DESCRIPTION
(Reuters)
STOCK INFO/RESEARCH
(MSN)
COMPETITORS
(CNN Money)
OWNERSHIP
(MSN)
KEY DEVELOPMENTS
(MSN),
RECENT NEWS
(MSN) &
HEADLINES (Yahoo)
HISTORICAL PRICES (Yahoo)
&
PRICE CHART
(IQChart)
RISK LEVEL: 3
(Average)
(MSN)
COMPANY'S WEB SITE
|
Management's Effectiveness (Trailing
12 Mo.) |
. . . |
Return on Equity: |
22.94% |
|
Profitability (Trailing
12 Mo.) |
. . . |
Profit Margin: |
6.35% |
|
Stock's Growth Record
(Trailing
12 Mo.) |
. . . |
Revenue: |
11.16% |
|
. . . |
EPS: |
-5.87% |
|
. . . |
Price: |
110.03% |
|
. . . |
Dividend: |
NA |
| PE & EPS (Trailing 12 Mo.) |
. . . |
Price/Earnings: |
17.91 |
|
. . . |
Earnings/Share: |
6.92 |
|
Price / Share (Pick Date, Closing Price) |
. . . |
Pick Date 06/06/2008: |
$123.92 |
COMMENT: The stock's pick price (of $123.92 is over the 13-day EMA and
over 50-day EMA price range; i.e.,
higher than
the 13-day EMA price
(of $122.88)
and higher than the 50-day EMA (of $113.56) by 0.85% and 9.12% respectively. This suggests that the pick price
is presently
NOT timely NOR advantageous buy
price for the stock. (Note: A stock's EMA price changes with
time. SEE also: ACE'S research report "ACE'S
"Timely"
& "Untimely" Stocks - How to Use and How They Perform" ).
|
. . . |
|
|
| Price
/ Share (13-day EMA) |
. . . |
06/06/2008: |
$122.88 |
| Price
/ Share (50-day EMA) |
. . . |
06/06/2008: |
$113.56 |
| Price
/ Share (13-day EMA) |
. . . |
|
Current:
|
| Price
/ Share (50-day EMA) |
. . . |
|
Current: |
| Price
/ Share (Current) |
. . . |
Current Price |
Quote |
| Price
/ Share (Historical) |
. . . |
Historical Price |
Quote
|
SPECIAL NOTE:
1. Hess' new Pony oil find
estimated to hold 200M barrels.
(Emii.com;
June 6 2008)
2.
Hess among Street's Top 5 large caps.
(Street.com;
June 4, 2008)
3.
Hess' reserves may double on Brazil offshore stake.
(Bloomberg.com;
May 19, 2008)
4.
Hess' 1Q net income doubled with increased production and record high oil
prices.
(MarketWatch;
April 30, 2008)
5. 2008 Outlook for the S&P 500's 2007 top
10 performing stocks. (Forbes;
December 28, 2007)
^Top page
 Sociedad Quimica Y Minera de Chile ADS or Chemical & Mining
Co. of Chile(NYSE:
SQM)
is an integrated producer of potassium nitrate, iodine and lithium carbonate.
The Company also produce other specialty plant nutrition products,
iodine and lithium derivatives, and certain industrial chemicals, including
industrial nitrates. The Company's products are sold in over 100 countries and generates approximately 84% of its
revenues from countries outside Chile. The Company's products are mainly
derived from mineral deposits found in two regions of Chile, where caliche ore
and brine deposits are mined and processed. The caliche ore in northern Chile
contains the largest known nitrate and iodine deposits in the world and is the
world’s only commercially exploited source of natural nitrates.
Sociedad Quimica Y Minera de Chile ADS or Chemical & Mining
Co. of Chile(NYSE:
SQM)
is an integrated producer of potassium nitrate, iodine and lithium carbonate.
The Company also produce other specialty plant nutrition products,
iodine and lithium derivatives, and certain industrial chemicals, including
industrial nitrates. The Company's products are sold in over 100 countries and generates approximately 84% of its
revenues from countries outside Chile. The Company's products are mainly
derived from mineral deposits found in two regions of Chile, where caliche ore
and brine deposits are mined and processed. The caliche ore in northern Chile
contains the largest known nitrate and iodine deposits in the world and is the
world’s only commercially exploited source of natural nitrates.
The
stock's price gained 111.4% over the past 3 months (vs. the Industry's 93.5%);
172.0% over the past 6 months (vs. the Industry's 95.5%); and 175.1% over
the past 12 months (vs. the Industry's 139.2%). The Company
is classified as a mid-cap growth company (with a market cap of $11.96B) that
is rated to outperform the market over the next six months with a Risk Level of
3 (Average). The Company was founded in 1968. The Company's
principal executive offices are located at Santiago, Chile.
The Company
has
3,745 employees.
Sector: Basic
Materials;
Industry:
Chemical Manufacturing;
Ticker: SQM;
Exch:
NYSE;
06/13/08
Closing Price: $45.45
STOCK GRADE (ASG): 49.73 (GOOD)
BUSINESS & FINANCIAL SUMMARY;
KEY STATS
(Yahoo)
EXPANDED BUSINESS DESCRIPTION
(Reuters)
STOCK INFO/RESEARCH
(MSN)
COMPETITORS
(CNN Money)
OWNERSHIP
(MSN)
KEY DEVELOPMENTS
(MSN),
RECENT NEWS
(MSN) &
HEADLINES (Yahoo)
HISTORICAL PRICES (Yahoo)
&
PRICE CHART
(IQChart)
RISK LEVEL: 3
(Average)
(MSN)
COMPANY'S WEB SITE
|
Management's Effectiveness (Trailing
12 Mo.) |
. . . |
Return on Equity: |
16.99% |
|
Profitability (Trailing
12 Mo.) |
. . . |
Profit Margin: |
15.81% |
|
Stock's Growth Record
(Trailing
12 Mo.) |
. . . |
Revenue: |
16.40% |
|
. . . |
EPS: |
23.21% |
|
. . . |
Price: |
175.09% |
|
. . . |
Dividend: |
44.14 |
| PE & EPS (Trailing 12 Mo.) |
. . . |
Price/Earnings: |
59.10 |
|
. . . |
Earnings/Share: |
0.77 |
|
Price / Share (Pick Date, Closing Price) |
. . . |
Pick Date 06/13/2008: |
$45.45 |
COMMENT: The stock's pick price (of $45.45 is over the 13-day EMA and
over 50-day EMA price range; i.e.,
higher than
the 13-day EMA price
(of $41.74)
and higher than the 50-day EMA (of $33.49) by 8.88% and 35.71% respectively. This suggests that the pick price
is presently
NOT timely NOR advantageous buy
price for the stock. (Note: A stock's EMA price changes with
time. SEE also: ACE'S report "ACE'S
"Timely"
& "Untimely" Stocks - How to Use and How They Perform" ).
|
. . . |
|
|
| Price
/ Share (13-day EMA) |
. . . |
06/13/2008: |
$41.74 |
| Price
/ Share (50-day EMA) |
. . . |
06/13/2008: |
$33.49 |
| Price
/ Share (13-day EMA) |
. . . |
|
Current:
|
| Price
/ Share (50-day EMA) |
. . . |
|
Current: |
| Price
/ Share (Current) |
. . . |
Current Price |
Quote |
| Price
/ Share (Historical) |
. . . |
Historical Price |
Quote
|
SPECIAL NOTE:
1. Companies with more than
momentum for their stocks' rise.
(Motley
Fool; JUne 10, 2008)
2.
SQM's 2008 first quarter earnings up 50% plus.
(SmartBrief;
April 29, 2008)
3.
SQM in joint venture to produce and distribute potassium nitrate in China.
(RTT
News; May 29, 2008)
^Top page
 Cabot Oil & Gas Corp. (NYSE:
COG)
is an independent oil and gas company engaged in the development, exploitation
and exploration of oil and gas
properties located in North America.
Cabot's five principal areas of operation are the Appalachian
Basin, onshore Gulf Coast, including south and east Texas and north Louisiana,
the Rocky Mountains, the Anadarko Basin and the deep gas basin of Western
Canada. The principal areas are run under four operating regions: the East
Region, Gulf Coast Region, West Region and Canadian Region. The East region
activities are concentrated primarily in West Virginia. This region includes a
large acreage position, a high concentration of wells, natural gas gathering and
pipeline systems, and storage capacity.
Cabot Oil & Gas Corp. (NYSE:
COG)
is an independent oil and gas company engaged in the development, exploitation
and exploration of oil and gas
properties located in North America.
Cabot's five principal areas of operation are the Appalachian
Basin, onshore Gulf Coast, including south and east Texas and north Louisiana,
the Rocky Mountains, the Anadarko Basin and the deep gas basin of Western
Canada. The principal areas are run under four operating regions: the East
Region, Gulf Coast Region, West Region and Canadian Region. The East region
activities are concentrated primarily in West Virginia. This region includes a
large acreage position, a high concentration of wells, natural gas gathering and
pipeline systems, and storage capacity.
The
stock's price gained 43.3% over the past 3 months (vs. the Industry's 126.7%);
65.8% over the past 6 months (vs. the Industry's 94.8%); and 58.4% over
the past 12 months (vs. the Industry's 160.5%). The Company
is classified as a mid-cap growth company (with a market cap of $6.50B) that
is rated to outperform the market over the next six months with a Risk Level of
3 (Average). The Company was founded in 1989. The Company's
principal executive offices are located at Houston, Texas.
The Company
has
404 employees.
Sector:
Energy;
Industry:
Oil & Gas Operations;
Ticker:
COG;
Exch:
NYSE;
06/20/08
Closing Price:
$65.40
STOCK GRADE (ASG): 51.26 (VERY GOOD)
BUSINESS & FINANCIAL SUMMARY;
KEY STATS
(Yahoo)
EXPANDED BUSINESS DESCRIPTION
(Reuters)
STOCK INFO/RESEARCH
(MSN)
COMPETITORS
(CNN Money)
OWNERSHIP
(MSN)
KEY DEVELOPMENTS
(MSN),
RECENT NEWS
(MSN) &
HEADLINES (Yahoo)
HISTORICAL PRICES (Yahoo)
&
PRICE CHART
(IQChart)
RISK LEVEL: 3
(Average)
(MSN)
COMPANY'S WEB SITE
|
Management's Effectiveness (Trailing
12 Mo.) |
. . . |
Return on Equity: |
16.24% |
|
Profitability (Trailing
12 Mo.) |
. . . |
Profit Margin: |
21.68% |
|
Stock's Growth Record
(Trailing
12 Mo.) |
. . . |
Revenue: |
-3.91% |
|
. . . |
EPS: |
-52.41% |
|
. . . |
Price: |
58.39% |
|
. . . |
Dividend: |
37.50 |
| PE & EPS (Trailing 12 Mo.) |
. . . |
Price/Earnings: |
39.56 |
|
. . . |
Earnings/Share: |
1.68 |
|
Price / Share (Pick Date, Closing Price) |
. . . |
Pick Date 06/20/2008: |
$65.40 |
COMMENT: The stock's pick price (of $65.40 is under the 13-day EMA and
over 50-day EMA price range; i.e.,
lower than
the 13-day EMA price
(of $66.56)
and higher than the 50-day EMA (of $61.57) by -0.72% and 7.32% respectively. This suggests that the pick price
IS presently
timely AND advantageous buy
price for the stock. (Note: A stock's EMA price changes with
time. SEE also: ACE'S report "ACE'S
"Timely"
& "Untimely" Stocks - How to Use and How They Perform" ).
|
. . . |
|
|
| Price
/ Share (13-day EMA) |
. . . |
06/20/2008: |
$66.56 |
| Price
/ Share (50-day EMA) |
. . . |
06/20/2008: |
$61.57 |
| Price
/ Share (13-day EMA) |
. . . |
|
Current:
|
| Price
/ Share (50-day EMA) |
. . . |
|
Current: |
| Price
/ Share (Current) |
. . . |
Current Price |
Quote |
| Price
/ Share (Historical) |
. . . |
Historical Price |
Quote
|
SPECIAL NOTE:
1. Where energy stock players
put their money.
(Forbes;
May 27, 2008)
2.
Cabot Oil's first quarter 2008 financial results.
(BNet;
April 30 2008)
3.
Cabot Oil provides operations update.
(BNet;
April 3, 2008)
4.
Best oil stock picks for 2008.
(CNN
Money; January 15, 2008)
^Top page
 Gerdau S.A. ADR (NYSE:
GGB)
is a leading producer of long steel products in Brazil and Latin America,
producing about 7 million tons of long steel a year, in the form of billets,
bars, wire rods, rebar, drawn products, nails, structural shapes, beams, and
more.
Gerdau
also manufactures a variety of finished products, including nails--the company's
original product--wire, wire mesh, and wire fencing. The Company also produces
crude steel, flat steel products, and a range of specialty steels, principally
for the automotive industry. Much of
Gerdau's
growth lies in domestic and international acquisitions which had enabled it to
build an international network of manufacturing facilities. Gerdau S.A. ADR (NYSE:
GGB)
is a leading producer of long steel products in Brazil and Latin America,
producing about 7 million tons of long steel a year, in the form of billets,
bars, wire rods, rebar, drawn products, nails, structural shapes, beams, and
more.
Gerdau
also manufactures a variety of finished products, including nails--the company's
original product--wire, wire mesh, and wire fencing. The Company also produces
crude steel, flat steel products, and a range of specialty steels, principally
for the automotive industry. Much of
Gerdau's
growth lies in domestic and international acquisitions which had enabled it to
build an international network of manufacturing facilities.
The
stock's price gained 51.3% over the past 3 months (vs. the Industry's 74.3%);
57.3% over the past 6 months (vs. the Industry's 92.5%); and 80.5% over
the past 12 months (vs. the Industry's 277.3%). The Company
is classified as a large-cap growth company (with a market cap of $30.64B) that
is rated to outperform the market over the next six months with a Risk Level of
3 (Average). The Company started operation in 1901 with the
establishment of Pontas de Paris Nail Factory. The Company's principal
executive offices are located at Rio Grande do Sul, Brazil.
The Company
has
36,925 employees.
Sector:
Basic Materials;
Industry:
Iron & Steel;
Ticker: GGB;
Exch:
NYSE;
06/27/08
Closing Price:
$23.12
STOCK GRADE (ASG): 44.37 (GOOD)
BUSINESS & FINANCIAL SUMMARY;
KEY STATS
(Yahoo)
EXPANDED BUSINESS DESCRIPTION
(Reuters)
STOCK INFO/RESEARCH
(MSN)
COMPETITORS
(CNN Money)
OWNERSHIP
(MSN)
KEY DEVELOPMENTS
(MSN),
RECENT NEWS
(MSN) &
HEADLINES (Yahoo)
HISTORICAL PRICES (Yahoo)
&
PRICE CHART
(IQChart)
RISK LEVEL: 3
(Average)
(MSN)
COMPANY'S WEB SITE
|
Management's Effectiveness (Trailing
12 Mo.) |
. . . |
Return on Equity: |
30.44% |
|
Profitability (Trailing
12 Mo.) |
. . . |
Profit Margin: |
21.61% |
|
Stock's Growth Record
(Trailing
12 Mo.) |
. . . |
Revenue: |
33.52% |
|
. . . |
EPS: |
5.85% |
|
. . . |
Price: |
80.48% |
|
. . . |
Dividend: |
-52.84 |
| PE & EPS (Trailing 12 Mo.) |
. . . |
Price/Earnings: |
13.93 |
|
. . . |
Earnings/Share: |
1.66 |
|
Price / Share (Pick Date, Closing Price) |
. . . |
Pick Date 06/27/2008: |
$23.12 |
COMMENT: The stock's pick price (of $23.12 is under the 13-day EMA and
over 50-day EMA price range; i.e.,
lower than
the 13-day EMA price
(of $24.06)
and higher than the 50-day EMA (of $22.76) by -3.89% and 1.58% respectively. This suggests that the pick price
IS presently
timely AND advantageous buy
price for the stock. (Note: A stock's EMA price changes with
time. SEE also: ACE'S report "ACE'S
"Timely"
& "Untimely" Stocks - How to Use and How They Perform" ).
|
. . . |
|
|
| Price
/ Share (13-day EMA) |
. . . |
06/27/2008: |
$24.06 |
| Price
/ Share (50-day EMA) |
. . . |
06/27/2008: |
$22.76 |
| Price
/ Share (13-day EMA) |
. . . |
|
Current:
|
| Price
/ Share (50-day EMA) |
. . . |
|
Current: |
| Price
/ Share (Current) |
. . . |
Current Price |
Quote |
| Price
/ Share (Historical) |
. . . |
Historical Price |
Quote
|
SPECIAL NOTE:
1. Gerdau is in Top 25 list of
world's most respected companies.
(Reputation
Institute; June 5, 2008)
2. Gerdau is one of South
America's best stocks.
(Motley
Fool; June 3, 2008)
3.
A booming Brazil.
(MSN
Money; May 15, 2008)
4.
Gerdau reports increased production and revenues for 1st quarter of 2008.
(MSN
Money; May 12 2008)
^Top page
|